Dynamic Multi-Indicator Trend Recognition Strategy with Triple Sync Analysis

Overview
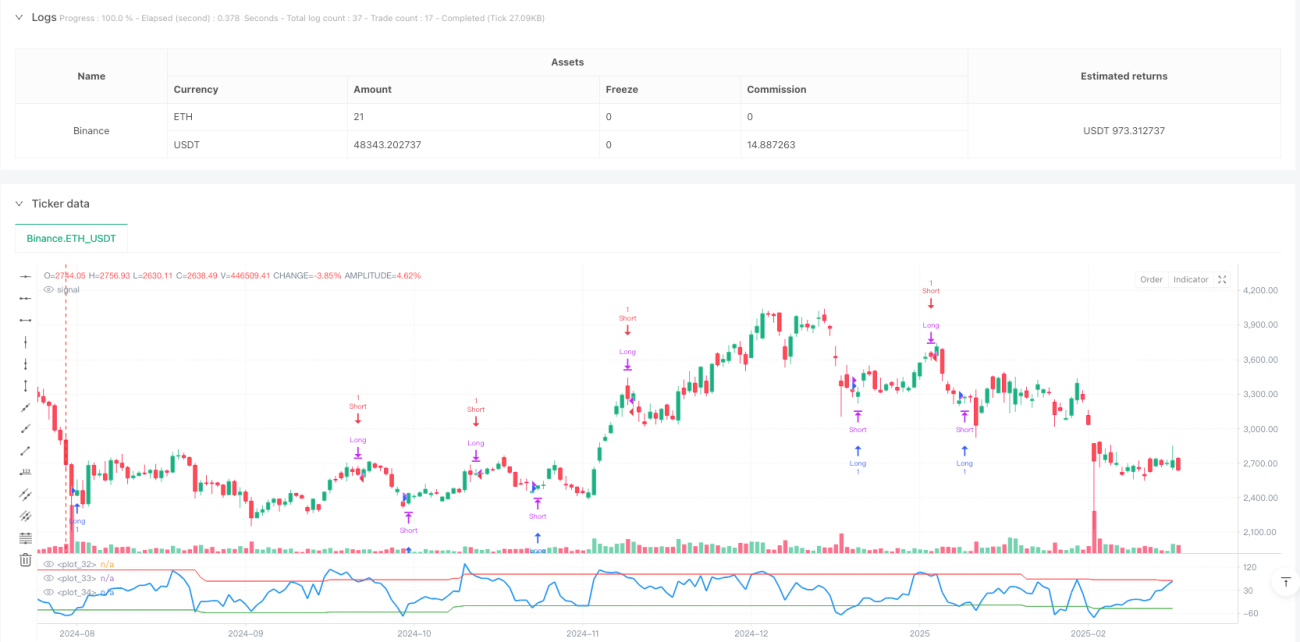
The Dynamic Multi-Indicator Trend Recognition Strategy with Triple Sync Analysis is a comprehensive technical analysis tool that combines the Average Directional Index (ADX), Stochastic RSI, and Commodity Channel Index (CCI). This strategy synthesizes these three powerful technical indicators into a Snake Line to achieve high-precision identification of market trends and potential reversal points. The strategy employs dynamic upper and lower bands as trading signal triggers, capable of adapting to volatility characteristics in different market environments.
Strategy Principle
The core of the strategy lies in the synergistic effect of the triple indicators. First, ADX calculates trend strength to ensure trades occur under clear trending conditions. Second, Stochastic RSI effectively identifies overbought and oversold conditions through smoothing RSI values. Finally, CCI provides early warning of potential trend changes by measuring price deviation from average levels. The values of these three indicators are normalized and combined into the Snake Line, which generates trading signals in conjunction with dynamic bands. Long signals are generated when the Snake Line breaks above the lower band, and short signals when it breaks below the upper band.
Strategy Advantages
- Multi-dimensional Analysis: Integrates multiple technical indicators for comprehensive market analysis, improving signal reliability.
- Dynamic Adaptation: Dynamic band design allows the strategy to self-adapt to different market environments.
- Trend Confirmation: ADX incorporation ensures trade direction aligns with major trends, improving success rate.
- Signal Smoothing: Combination of multiple indicators reduces false signal frequency.
- Risk Control: Clear entry and exit conditions help control trading risk.
Strategy Risks
- Signal Lag: Multiple technical indicators may result in delayed signals.
- Sideways Market Performance: May generate frequent trading signals in range-bound markets.
- Parameter Sensitivity: Strategy effectiveness is sensitive to parameter settings, requiring careful adjustment.
- Computational Complexity: Multi-indicator combination increases computational complexity, potentially affecting execution efficiency.
Strategy Optimization Directions
- Volatility Filtering: Consider adding ATR indicator for volatility assessment, reducing trade frequency in low volatility environments.
- Parameter Adaptation: Consider dynamic parameter adjustment based on market conditions to improve strategy adaptability.
- Trend Strength Filtering: Set minimum ADX threshold to trade only during clear trends.
- Enhanced Stop Loss: Add dynamic ATR-based stop loss settings to improve risk control.
- Volume Confirmation: Incorporate volume indicators for signal confirmation to improve trade reliability.
Summary
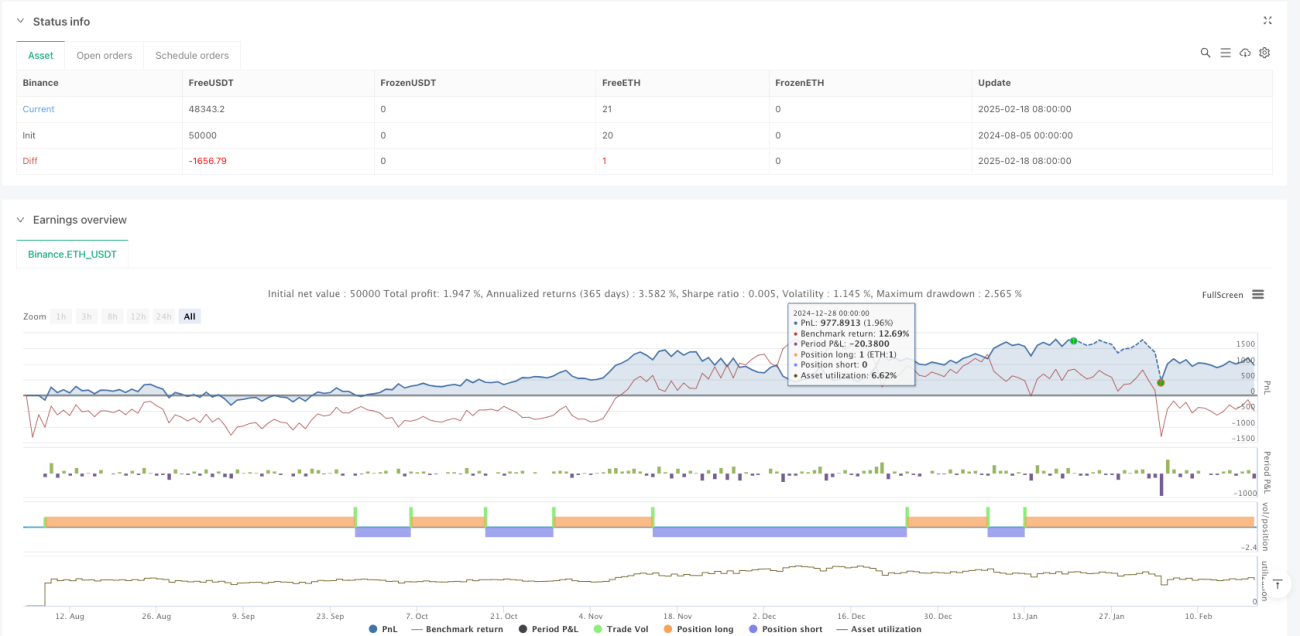
The Dynamic Multi-Indicator Trend Recognition Strategy with Triple Sync Analysis builds a comprehensive market analysis framework through innovative combination of multiple classic technical indicators. The strategy's core advantages lie in its multi-dimensional analysis capability and dynamic adaptation characteristics, while attention must be paid to potential risks such as signal lag and parameter sensitivity. Through improvements like volatility filtering and parameter adaptation optimization, the strategy's overall performance can be further enhanced. This is a strategy framework suitable for medium to long-term trend trading, particularly effective in markets with clear trends.
- 1