
Overview
This strategy is a trend-following trading system that combines multiple technical indicators. It captures trend momentum using MACD, confirms overbought/oversold conditions with RSI and StochRSI, and validates trading signals using volume indicators. The strategy employs a dynamic volume threshold mechanism to ensure trades are executed only when market activity is sufficient.
Strategy Principles
The core logic is based on the following key elements:
- MACD indicator identifies price trends and momentum changes, generating initial trading signals through fast and slow line crossovers
- RSI serves as a trend confirmation tool, helping determine if the market is in a strong (>50) or weak (<50) state
- StochRSI provides more sensitive market momentum information by applying stochastic calculations to RSI
- Volume verification mechanism requires trading volume to exceed 1.5 times the 14-period average volume
The system opens long positions when:
- MACD fast line crosses above the slow line
- RSI is above 50
- StochRSI K-line crosses above D-line
- Current volume exceeds the threshold
The system opens short positions when:
- MACD fast line crosses below the slow line
- RSI is below 50
- StochRSI K-line crosses below D-line
- Current volume exceeds the threshold
Strategy Advantages
- Multiple technical indicators combination provides more reliable trading signals, reducing false signal risk
- Volume confirmation mechanism effectively filters out low liquidity trading opportunities
- High parameter adjustability facilitates optimization for different market environments
- Combination of trend following and momentum strategy captures both major trends and short-term opportunities
- Clear entry logic facilitates execution and backtesting verification
Strategy Risks
- Multiple indicator filtering may cause missed trading opportunities
- May generate frequent false breakout signals in ranging markets
- Lack of stop-loss and take-profit mechanisms increases money management risk
- Reliance on historical volume reference may fail in abnormal market conditions
- Combined lag of multiple technical indicators may delay entry timing
Risk control suggestions:
- Add stop-loss and take-profit mechanisms
- Introduce trend filters
- Optimize indicator parameter combinations
- Set maximum holding time limits
- Implement staged position building strategy
Strategy Optimization Directions
- Introduce adaptive parameter optimization mechanism for automatic indicator parameter adjustment based on market conditions
- Add volatility filters to apply different trading rules in various volatility environments
- Perfect money management system with dynamic position management and risk control mechanisms
- Develop smart filtering algorithms to reduce false signals in ranging markets
- Integrate market sentiment indicators to improve trading signal accuracy
Summary
This strategy constructs a relatively complete trading system through the synergistic combination of multiple technical indicators. The addition of volume confirmation mechanism improves trading signal reliability, but the system still needs improvement in risk control and parameter optimization. The strategy's core advantages lie in its clear logic and strong adjustability, making it suitable as a basic framework for further optimization and expansion. Traders are advised to thoroughly conduct historical data backtesting and parameter sensitivity analysis before live trading, and make appropriate adjustments based on specific market environments and personal risk preferences.
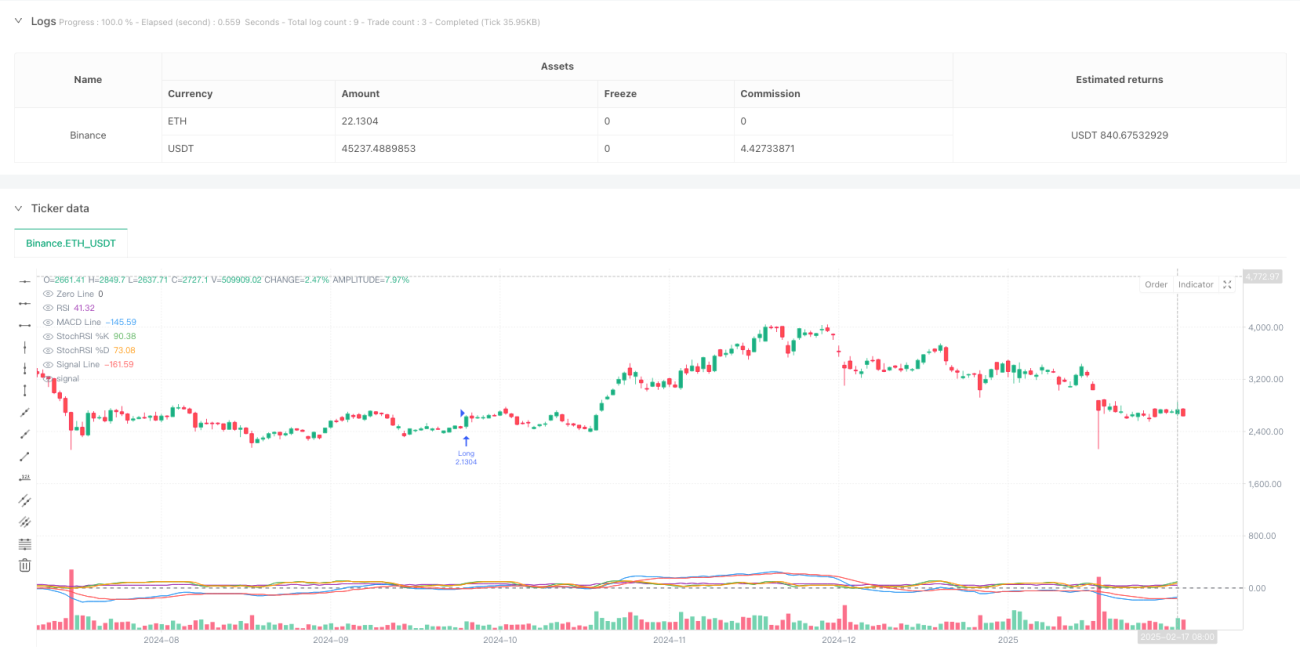
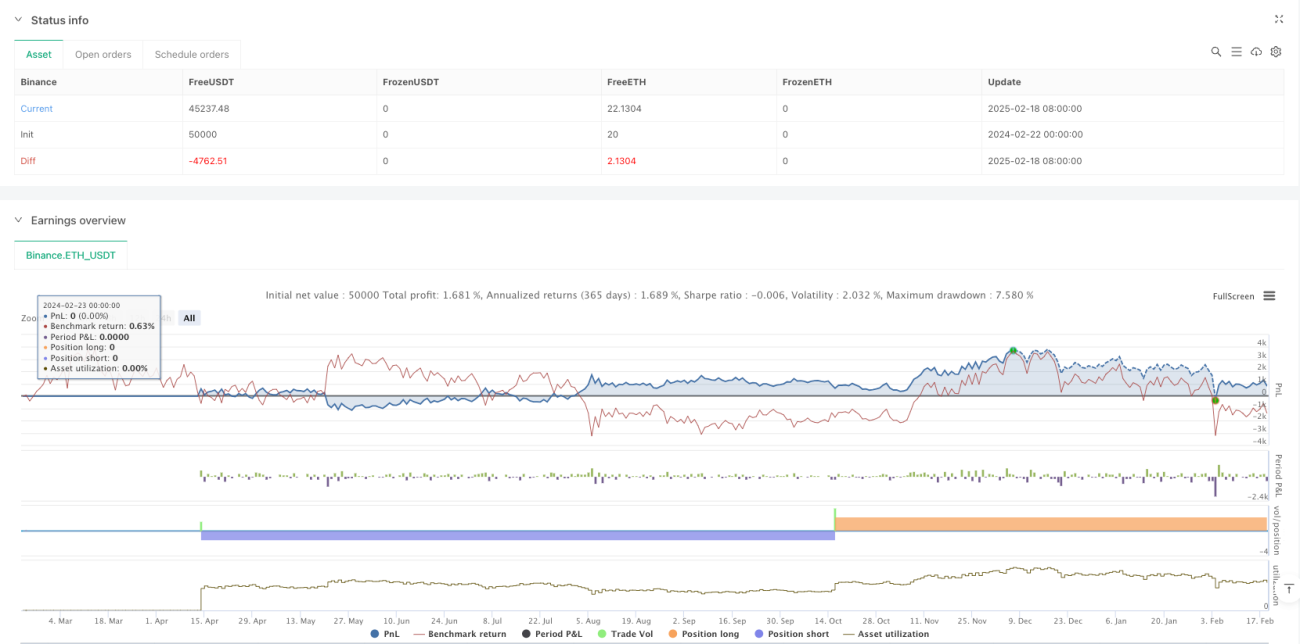
/*backtest
start: 2024-02-22 00:00:00
end: 2025-02-19 08:00:00
period: 1d
basePeriod: 1d
exchanges: [{"eid":"Binance","currency":"ETH_USDT"}]
*/

//@version=5
strategy("BTCUSDT Strategy with Volume, MACD, RSI, StochRSI", overlay=true, default_qty_type=strategy.percent_of_equity, default_qty_value=10)

// Input parameters- 1