
Overview
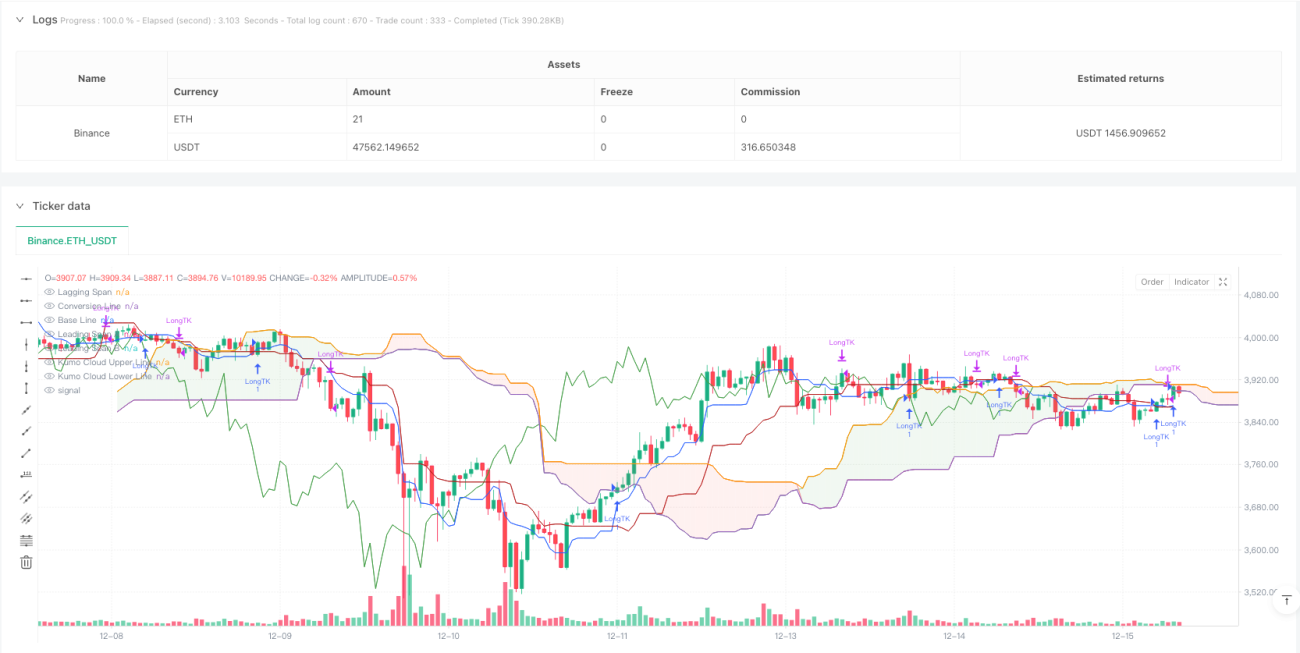
This strategy is an enhanced version of the classic Ichimoku Kinko Hyo system, utilizing dynamic crossovers between the Conversion and Base lines to identify trading signals. It incorporates automated trading signal generation and execution logic, along with visual labels to improve trend readability.
Strategy Principles
The strategy is built upon the five main lines of the Ichimoku system: Conversion Line (9 periods), Base Line (26 periods), Leading Span A, Leading Span B (52 periods), and Lagging Span. The primary trading signals are generated from crossovers between the Conversion and Base lines. Long positions are entered when the Conversion Line crosses above the Base Line and closed when it crosses below. The strategy employs dynamic Donchian channels to calculate each line by averaging the highest and lowest prices to reflect price volatility.
Strategy Advantages
- Systematic Trend Following - Combines multiple timeframe indicators for comprehensive trend capture.
- Visual Clarity - Utilizes color labels and cloud visualization for clear signal identification.
- Integrated Risk Management - Features built-in stop-loss mechanisms for automatic position closure on market reversals.
- High Adaptability - Adjustable parameters allow adaptation to different market conditions.
- Signal Stability - Uses moving average crossovers to filter false signals and improve trade quality.
Strategy Risks
- Trend Reversal Delay - Inherent lag due to moving average calculations.
- Poor Performance in Ranging Markets - May generate false signals during consolidation phases.
- Parameter Sensitivity - Strategy performance significantly affected by parameter settings.
- Cloud Complexity - Multiple intersecting lines may complicate signal interpretation.
Optimization Directions
- Volatility Filtering - Incorporate ATR indicator for position sizing adjustment.
- Entry Timing Enhancement - Integrate momentum indicators like RSI for signal confirmation.
- Stop-Loss Refinement - Implement dynamic stop-loss based on cloud support levels.
- Volume Confirmation - Add volume analysis for signal validation.
- Market Environment Filtering - Include trend strength indicators for market condition selection.
Summary
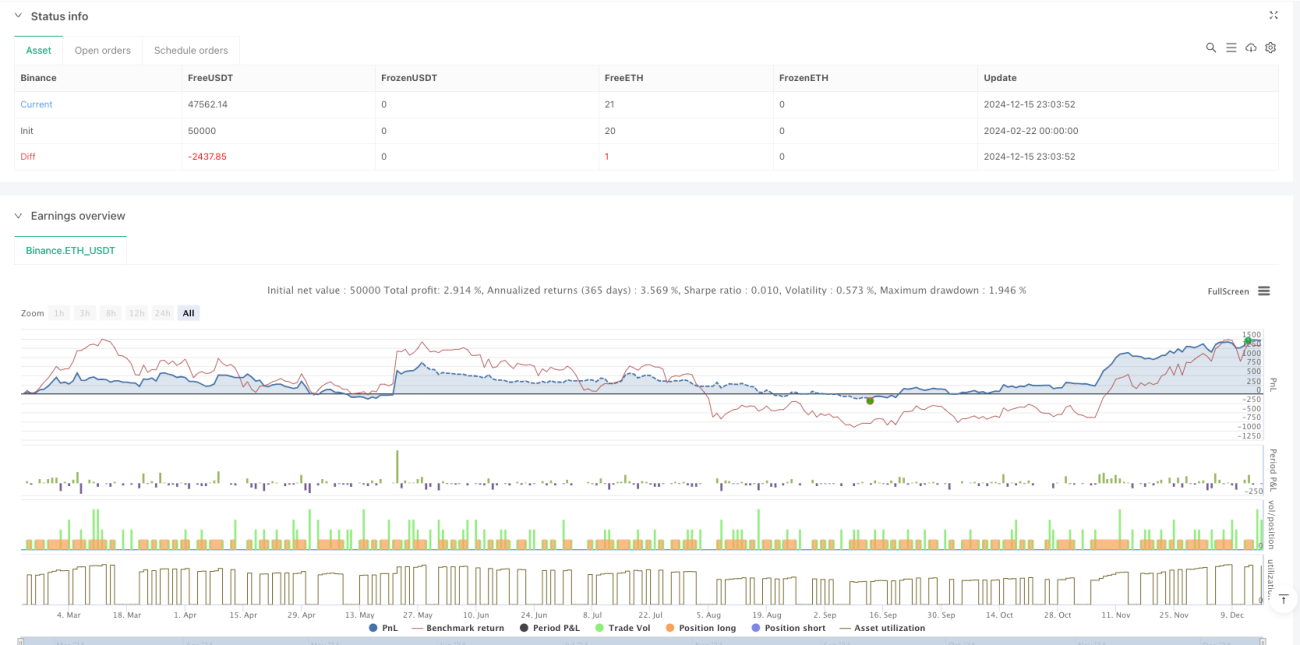
This strategy enhances the traditional Ichimoku system to create a comprehensive trend-following trading system. While it exhibits some lag, optimization through signal filtering and risk management enables stable performance in trending markets. Traders should adjust parameters based on market conditions and risk preferences while continuously monitoring strategy performance.
/*backtest
start: 2024-02-22 00:00:00
end: 2024-12-16 00:00:00
period: 1h
basePeriod: 1h
exchanges: [{"eid":"Binance","currency":"ETH_USDT"}]
*/

//@version=6

strategy(title="Ichimoku Cloud with Lables", shorttitle="Ichimoku", overlay=true)
conversionPeriods = input.int(9, minval=1, title="Conversion Line Length")- 1