
Overview
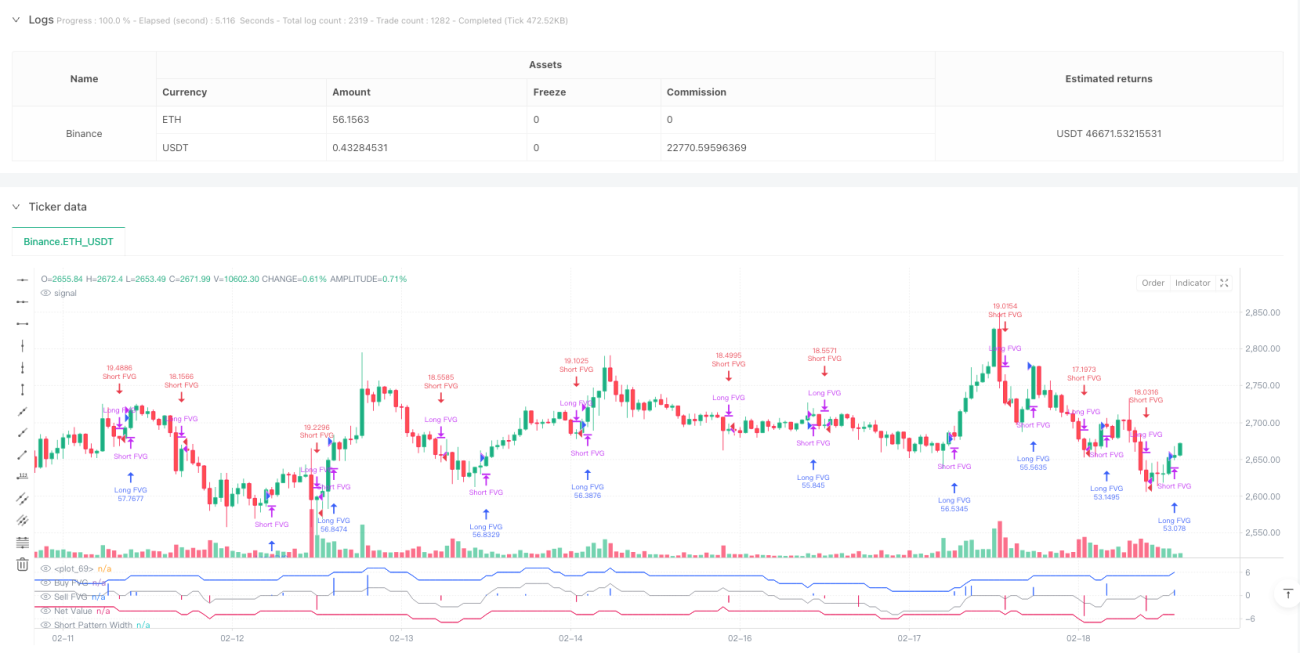
This strategy is an innovative trading system based on Fair Value Gaps (FVG), designed to capture potential trading opportunities by identifying price gaps and volume anomalies in the market. The strategy combines dynamic counting mechanisms and normalization processing, not only accurately identifying buy and sell signals but also helping traders better understand market structure through visualization.
Strategy Principles
The core of the strategy is to identify potential trading opportunities by monitoring price gaps between consecutive candles. Specifically:
- Bullish FVG (BFVG) forms when the current candle's low is higher than the high of two candles ago
- Bearish FVG (SFVG) forms when the current candle's high is lower than the low of two candles ago
- The strategy incorporates a verification mechanism based on volume and gap size, where only FVGs meeting verification conditions trigger trading signals
- Uses a 50-period dynamic counting window to accumulate the number of bullish and bearish FVGs
- Through normalization processing, gap widths are transformed into more intuitive indicator values
Strategy Advantages
- The system has a comprehensive signal verification mechanism, improving signal quality through dual confirmation of volume and gap magnitude
- Dynamic counting window effectively captures market trend changes
- Normalization processing makes signals comparable across different periods
- Strategy includes automatic position management, closing reverse positions before opening new ones
- Excellent visualization effects, making it easier for traders to understand market conditions
Strategy Risks
- FVG signals may generate false signals in highly volatile markets
- Fixed verification parameters may not be suitable for all market environments
- Lack of stop-loss and take-profit mechanisms may lead to significant drawdowns
- Frequent trading may result in high transaction costs
It is recommended to manage these risks by setting appropriate stop-loss levels and introducing market environment filters.
Optimization Directions
- Introduce adaptive parameter adjustment mechanisms to better adapt to different market environments
- Add trend filters to trade only in the direction of strong trends
- Design more sophisticated position management systems, including staged position building and dynamic stop-loss
- Consider transaction costs and optimize trading frequency
- Combine with other technical indicators to improve signal reliability
Summary
This is an innovative trading strategy based on price structure, capturing market opportunities through intelligent identification and verification of fair value gaps. The strategy's design concept is clear, implementation is professional, and it has good scalability. Through the suggested optimization directions, the strategy's stability and profitability can be further enhanced.
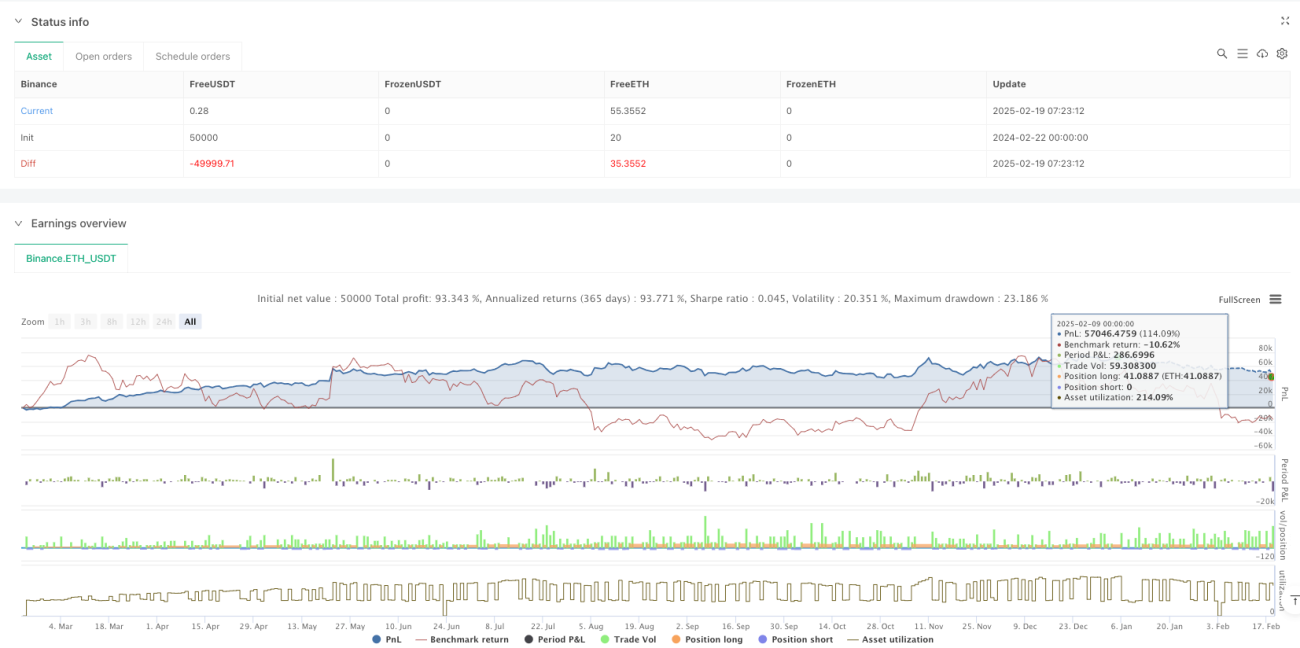
/*backtest
start: 2024-02-22 00:00:00
end: 2025-02-19 08:00:00
period: 1h
basePeriod: 1h
exchanges: [{"eid":"Binance","currency":"ETH_USDT"}]
*/

// ----------------------------------------------------------------------------
// This Pine Script™ code is subject to the terms of the Mozilla Public License
// 2.0 at https://mozilla.org/MPL/2.0/
// © OmegaTools- 1