
Overview
This strategy is a multi-indicator trend following trading system that combines analysis across three dimensions: market trend, momentum, and volatility. The core logic uses the Ichimoku Cloud to determine market trends, MACD histogram for momentum confirmation, Bollinger Band Width for market volatility filtering, while incorporating weekly timeframe trend confirmation, and managing risk through ATR-based dynamic stop-loss.
Strategy Principles
The strategy employs a multi-layer signal filtering mechanism: First, it determines the market trend by checking if price is above or below the Ichimoku Cloud's Leading Spans A and B; Second, it uses the MACD histogram to judge momentum strength, requiring the histogram to be greater than -0.05 for longs and less than 0 for shorts; Third, it incorporates a 50-period moving average on the weekly timeframe to confirm higher timeframe trend direction; Fourth, it uses Bollinger Band Width to filter low volatility conditions, only entering trades when the width exceeds 0.02. Stop-loss settings adapt to market volatility: using recent highs/lows in low volatility and ATR multipliers in high volatility conditions.
Strategy Advantages
- Multi-dimensional signal filtering: Effectively reduces false signals through combination of trend, momentum, and volatility indicators.
- Multi-timeframe analysis: Incorporates weekly trend confirmation to improve directional accuracy.
- Dynamic risk management: Adaptive stop-loss mechanism based on ATR and Bollinger Band Width that both protects profits and gives trends room to develop.
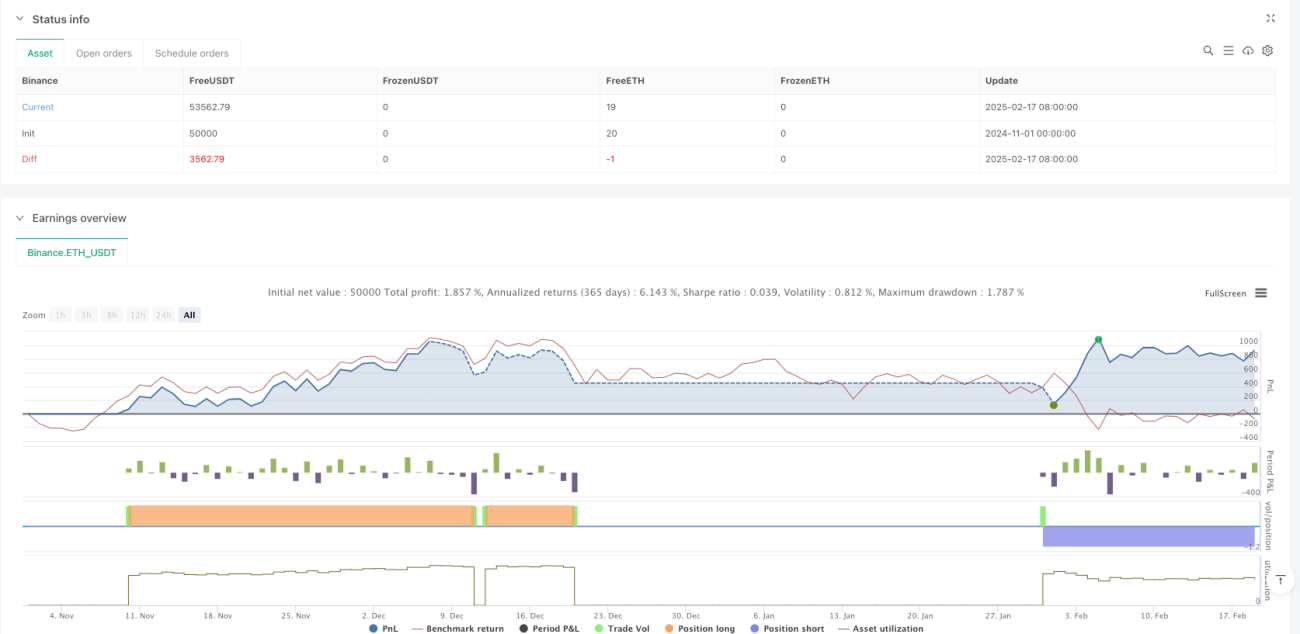
- Excellent backtesting results: Net profit 10.80%, profit factor 2.593, win rate 50.70%, maximum drawdown only 1.47%.
Strategy Risks
- Trend dependency: Strategy may generate frequent false signals in ranging markets.
- Parameter sensitivity: Multiple indicator parameters need optimization for different market conditions.
- Lag risk: Multiple signal filters may lead to delayed entries, missing part of the move.
- Backtesting limitations: Historical performance doesn't guarantee future results, live trading needs to consider slippage and fees.
Strategy Optimization Directions
- Signal system optimization: Can introduce other momentum indicators like RSI to enhance signal reliability.
- Position management optimization: Can dynamically adjust position size based on volatility.
- Take-profit optimization: Can add trailing stops or technical indicator-based profit targets.
- Market adaptability optimization: Dynamically adjust parameters for different market conditions.
Summary
The strategy builds a complete trend following system through multi-dimensional indicator fusion and multi-timeframe analysis, equipped with dynamic risk management mechanisms. While backtesting performance is excellent, attention must be paid to risks from changing market environments, and it's recommended to carefully validate and continuously optimize in live trading.
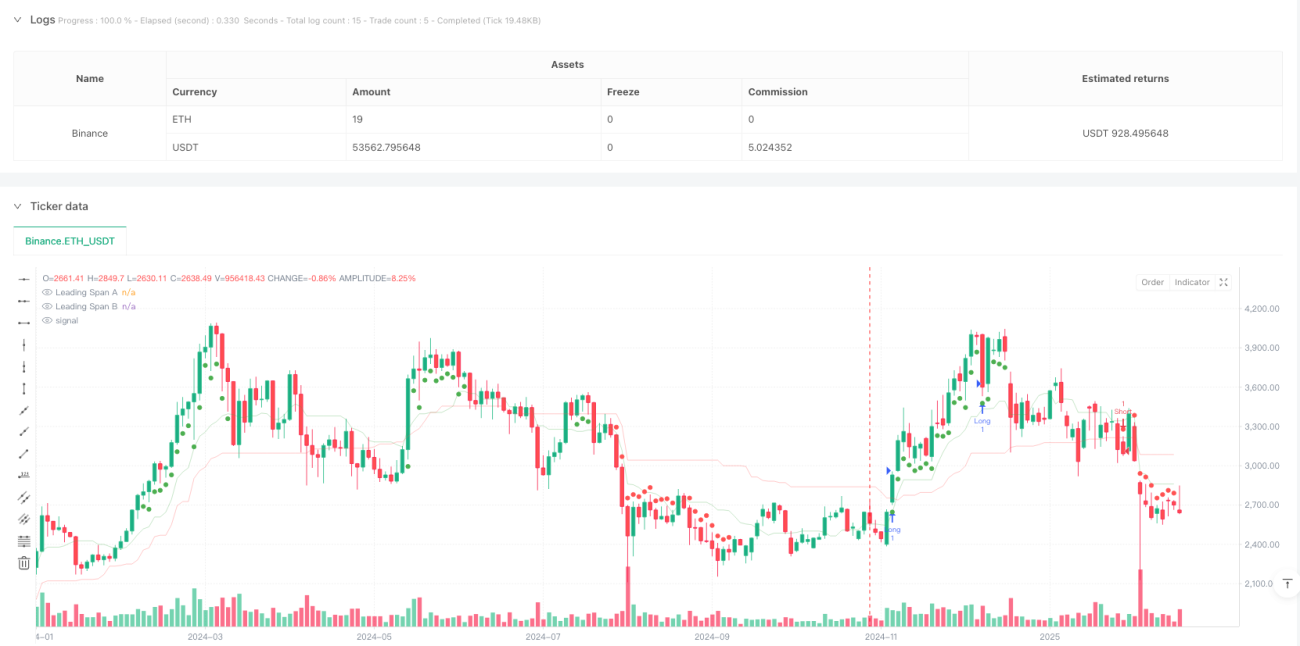
/*backtest
start: 2024-11-01 00:00:00
end: 2025-02-19 08:00:00
period: 2d
basePeriod: 2d
exchanges: [{"eid":"Binance","currency":"ETH_USDT"}]
*/

// This Pine Script™ code is subject to the terms of the Mozilla Public License 2.0 at https://mozilla.org/MPL/2.0/
// © FIWB
//@version=6
strategy("Momentum Edge Strategy - 1D BTC Optimized", overlay=true)- 1