
Overview
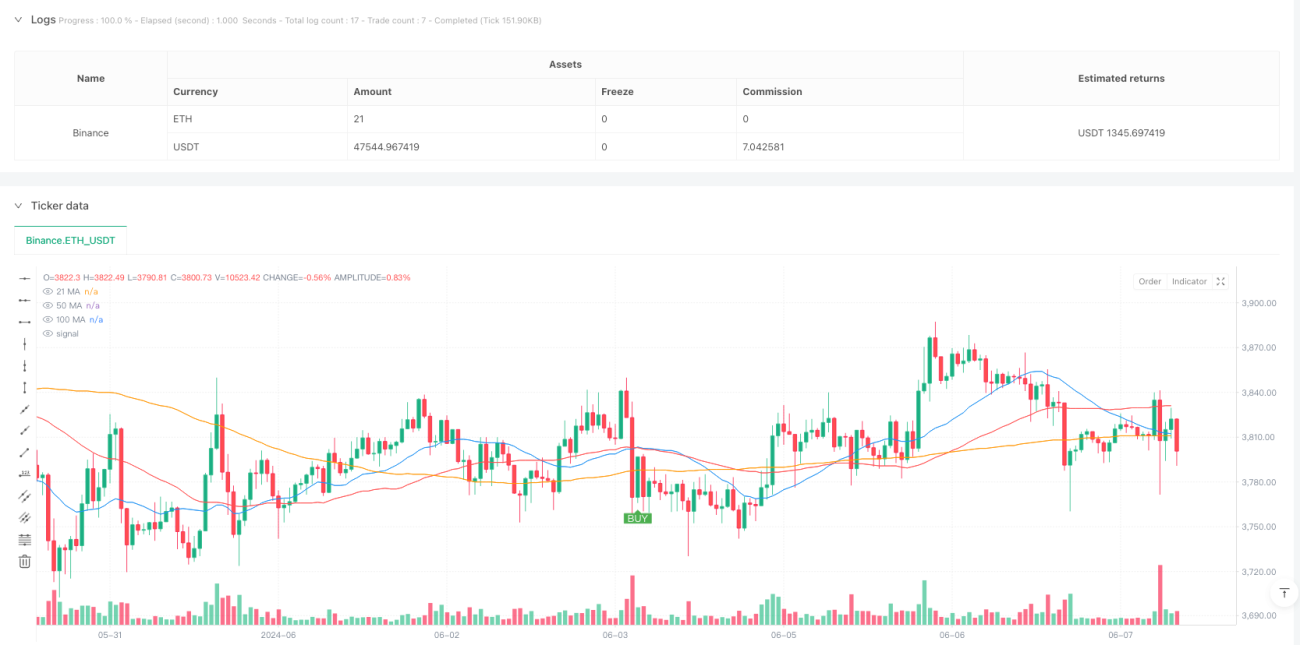
This is a trend-following strategy based on three Simple Moving Averages (SMA). The strategy utilizes the crossover and relative positions of 21, 50, and 100-period moving averages to identify market trends and generate trading signals. It primarily operates on a 5-minute timeframe, with recommended confirmation from the 30-minute chart.
Strategy Principle
The strategy employs a triple-filter mechanism to determine trading signals:
- Uses 21-period MA as fast line to capture short-term price movements
- Uses 50-period MA as medium-term line for crossover signals
- Uses 100-period MA as trend filter to ensure alignment with main trend
Buy conditions require:
- 21 MA crosses above 50 MA
- Both 21 MA and 50 MA are above 100 MA
Sell conditions require:
- 21 MA crosses below 50 MA
- Both 21 MA and 50 MA are below 100 MA
Strategy Advantages
- Multiple confirmation mechanisms reduce false signals
- Trend filtering improves trading success rate
- Clear entry and exit rules
- Applicable across multiple timeframes
- Risk-reward ratio set at 1:2 for long-term profitability
- Simple logic, easy to understand and execute
Strategy Risks
- Frequent trades in ranging markets
- MA lag may cause delayed entries and exits
- Quick reversals can lead to significant losses
- Parameters need adjustment for different market conditions
Risk control suggestions:
- Set stop loss below recent significant low
- Confirm trends on higher timeframes
- Avoid trading in sideways markets
- Regular strategy parameter evaluation
Strategy Optimization
- Incorporate volume indicators for trend strength confirmation
- Implement dynamic stop-loss mechanism
- Add trend strength filters
- Optimize parameter adaptation
- Integrate additional technical indicators
- Add market volatility filters
Summary
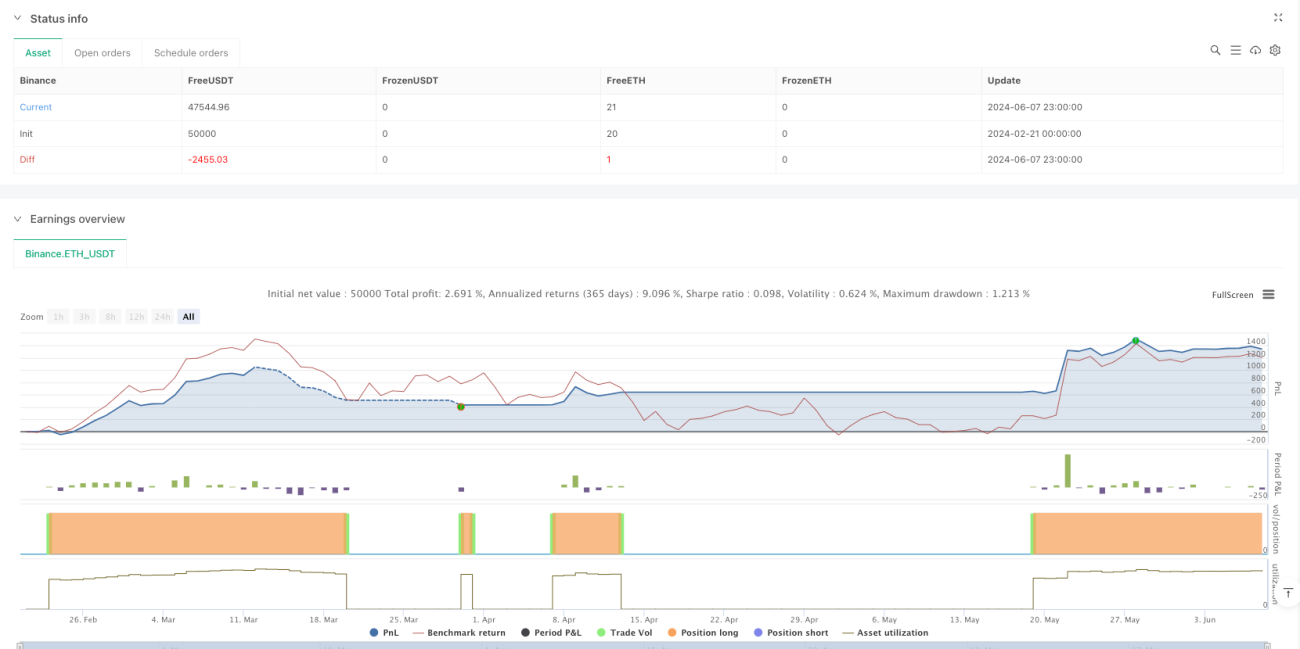
This is a well-structured trend-following strategy with clear logic. Through triple moving average filtering and trend confirmation mechanisms, it effectively reduces false signals and improves trading success rate. The strategy offers good scalability and can be optimized for different market conditions. Thorough backtesting and parameter optimization are recommended before live trading.
/*backtest
start: 2024-02-21 00:00:00
end: 2024-06-08 00:00:00
period: 1h
basePeriod: 1h
exchanges: [{"eid":"Binance","currency":"ETH_USDT"}]
*/

// This Pine Script™ code is subject to the terms of the Mozilla Public License 2.0 at https://mozilla.org/MPL/2.0/
// © Vezpa
//@version=5
strategy("Vezpa's Gold Strategy", overlay=true)- 1