Multi-Period Moving Average Ribbon and MACD Crossover Strategy System

MA EMA MACD SMA VWMA WMA SMMA RMA
Created on: 2025-02-21 10:51:25 Modified on: 2025-02-21 10:51:25
Copy: 1 Number of hits: 403
avatar of ianzeng123 ianzeng123
2
Follow
319
Followers

 Multi-Period Moving Average Ribbon and MACD Crossover Strategy System  Multi-Period Moving Average Ribbon and MACD Crossover Strategy System

Overview

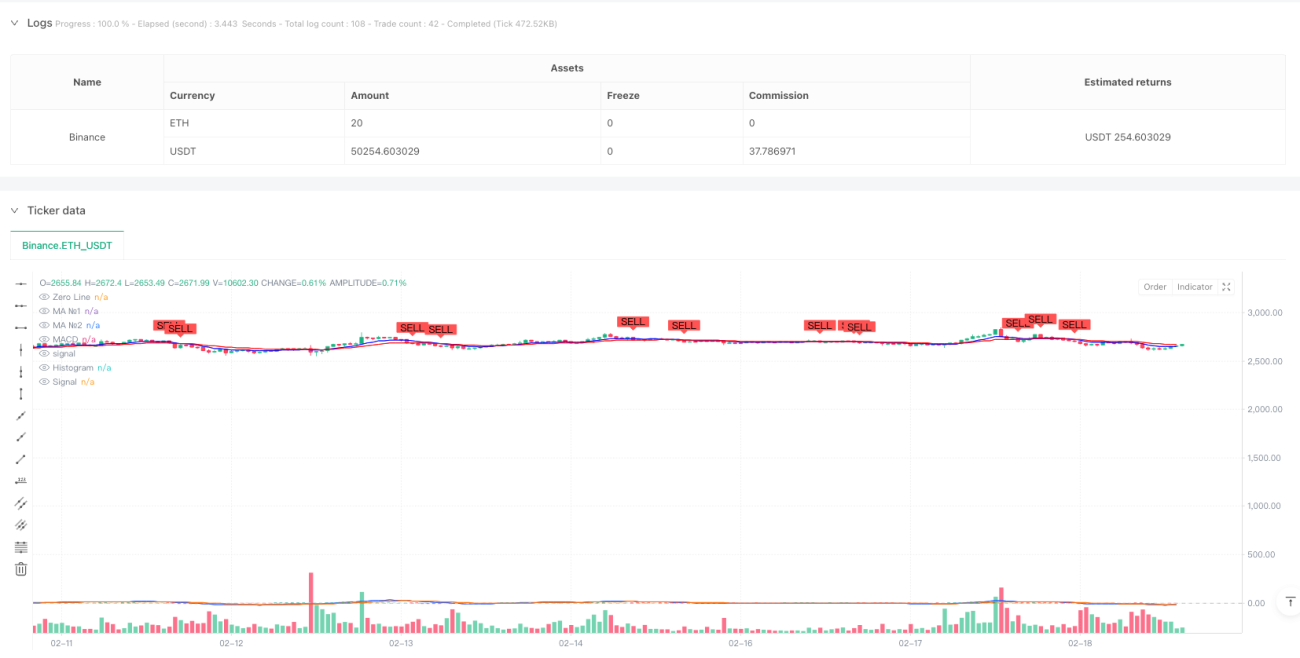
This strategy is a trading system that combines multi-period moving average ribbons with the MACD indicator. The strategy primarily determines market trends and trading opportunities through the crossover of short-term and long-term moving averages along with MACD signals. It incorporates daily trading reset logic to effectively prevent overnight risks.

Strategy Principles

The core logic consists of three main components: the moving average ribbon system, MACD indicator system, and intraday trading reset mechanism. The moving average ribbon comprises two different period lines (9 and 21), with options for various types including SMA, EMA, SMMA, WMA, and VWMA. The MACD system uses standard 12/26/9 parameters, utilizing the difference between fast and slow lines along with a signal line to judge trend momentum. Buy signals require both the short-term MA crossing above the long-term MA and the MACD line crossing above the signal line, while sell signals trigger upon either reverse crossing. Signal states reset at the start of each trading day, ensuring trading continuity and safety.

Strategy Advantages

  1. Dual signal confirmation reliability: Combines trend following and momentum indicators, significantly reducing false signal risks
  2. Flexible parameter configuration: Supports multiple types of moving averages, allowing optimization for different market characteristics
  3. Comprehensive risk control: Includes intraday trading reset mechanism, effectively avoiding overnight risks
  4. Outstanding visualization: Integrates clear buy/sell signal markers and ribbon display, facilitating trading decisions

Strategy Risks

  1. Trend reversal lag: Due to the use of moving averages, response might be slow during rapid market turns
  2. Ineffective in ranging markets: May generate frequent false signals in sideways, volatile markets
  3. Parameter optimization challenges: Optimal parameters may vary significantly across different market environments
  4. Execution delay impact: Significant price differences may occur between signal confirmation and actual execution in highly volatile markets

Strategy Optimization Directions

  1. Introduce volatility filtering: Recommend adding ATR or volatility indicators to adjust signal trigger thresholds in high volatility environments
  2. Optimize signal confirmation mechanism: Consider adding volume confirmation or price pattern confirmation to improve signal reliability
  3. Enhance risk management: Suggest incorporating dynamic stop-loss and profit targets to improve the strategy’s risk-reward ratio
  4. Market environment adaptation: Consider dynamic parameter adjustment based on different market states to improve strategy adaptability

Summary

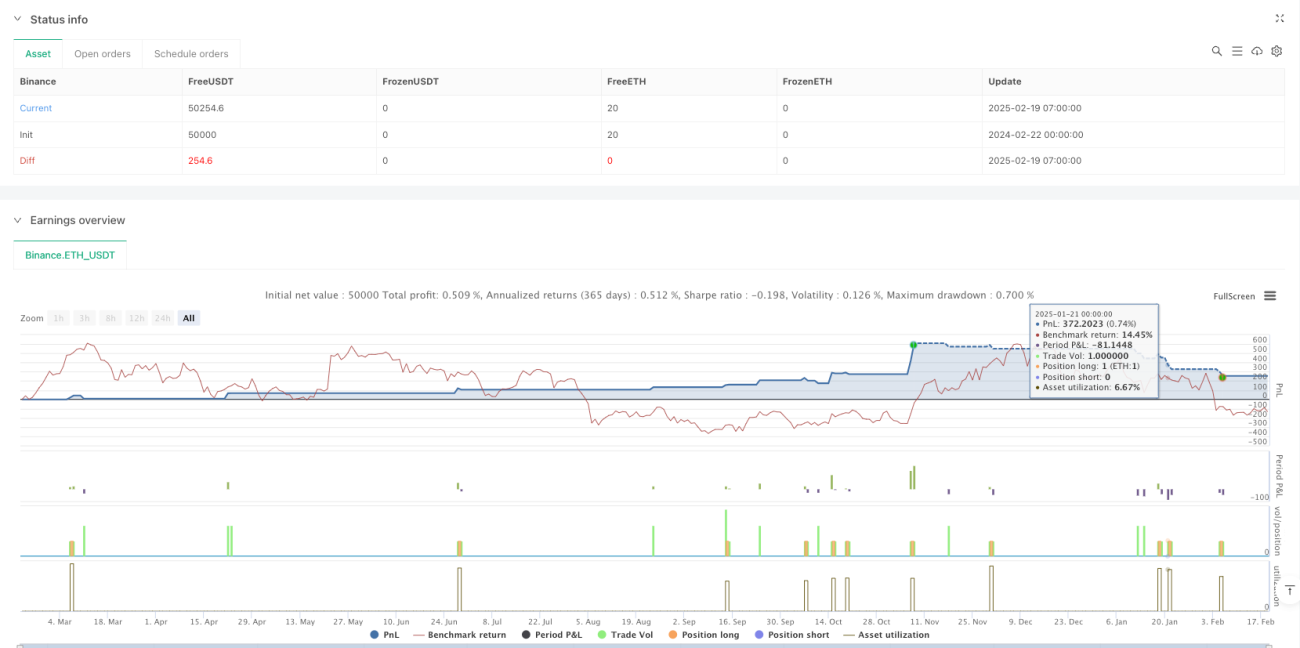
This strategy constructs a relatively comprehensive trading system by combining moving average ribbons and MACD indicators. While there are certain lag risks, the strategy can achieve good results in trending markets through proper parameter optimization and risk management. Traders are advised to conduct thorough backtesting before live implementation and adjust parameters according to specific market characteristics.

Strategy source code
/*backtest
start: 2024-02-22 00:00:00
end: 2025-02-19 08:00:00
period: 1h
basePeriod: 1h
exchanges: [{"eid":"Binance","currency":"ETH_USDT"}]
*/

//@version=6
strategy("Daily MA Ribbon + MACD Crossover with Buy/Sell Signals", overlay=true)

// === Daily Reset Logic ===
var bool newDay = false  // Initialize newDay as a boolean variable
newDay := bool(ta.change(time("D")))  // Cast the result of ta.change to boolean

// === Moving Average Ribbon ===
ma(source, length, type) =>
    type == "SMA" ? ta.sma(source, length) :
     type == "EMA" ? ta.ema(source, length) :
     type == "SMMA (RMA)" ? ta.rma(source, length) :
     type == "WMA" ? ta.wma(source, length) :
     type == "VWMA" ? ta.vwma(source, length) :
     na

// MA1 (Short-term MA)
show_ma1   = input(true, "MA №1", inline="MA #1")
ma1_type   = input.string("EMA", "", inline="MA #1", options=["SMA", "EMA", "SMMA (RMA)", "WMA", "VWMA"])
ma1_source = input(close, "", inline="MA #1")
ma1_length = input.int(9, "", inline="MA #1", minval=1)  // Short-term MA (e.g., 9-period)
ma1_color  = input(color.blue, "", inline="MA #1")
ma1 = ma(ma1_source, ma1_length, ma1_type)
plot(show_ma1 ? ma1 : na, color = ma1_color, title="MA №1")

// MA2 (Long-term MA)
show_ma2   = input(true, "MA №2", inline="MA #2")
ma2_type   = input.string("EMA", "", inline="MA #2", options=["SMA", "EMA", "SMMA (RMA)", "WMA", "VWMA"])
ma2_source = input(close, "", inline="MA #2")
ma2_length = input.int(21, "", inline="MA #2", minval=1)  // Long-term MA (e.g., 21-period)
ma2_color  = input(color.red, "", inline="MA #2")
ma2 = ma(ma2_source, ma2_length, ma2_type)
plot(show_ma2 ? ma2 : na, color = ma2_color, title="MA №2")

// === MACD ===
fast_length = input(12, "Fast Length")
slow_length = input(26, "Slow Length")
signal_length = input.int(9, "Signal Smoothing", minval=1, maxval=50)
sma_source = input.string("EMA", "Oscillator MA Type", options=["SMA", "EMA"])
sma_signal = input.string("EMA", "Signal Line MA Type", options=["SMA", "EMA"])

// Calculate MACD
fast_ma = sma_source == "SMA" ? ta.sma(close, fast_length) : ta.ema(close, fast_length)
slow_ma = sma_source == "SMA" ? ta.sma(close, slow_length) : ta.ema(close, slow_length)
macd = fast_ma - slow_ma
signal = sma_signal == "SMA" ? ta.sma(macd, signal_length) : ta.ema(macd, signal_length)
hist = macd - signal

// Plot MACD
hline(0, "Zero Line", color = color.new(#787B86, 50))
plot(hist, title = "Histogram", style = plot.style_columns, color = (hist >= 0 ? (hist[1] < hist ? #26A69A : #B2DFDB) : (hist[1] < hist ? #FFCDD2 : #FF5252)))
plot(macd, title = "MACD", color = #2962FF)
plot(signal, title = "Signal", color = #FF6D00)

// === Buy/Sell Signal Logic ===
// Condition 1: MA1 (Short-term) crosses above MA2 (Long-term)
ma_crossover = ta.crossover(ma1, ma2)

// Condition 2: MACD line crosses above Signal line
macd_crossover = ta.crossover(macd, signal)

// Buy Signal: Both conditions must be true
buy_signal = ma_crossover and macd_crossover

// Sell Signal: MA1 crosses below MA2 or MACD crosses below Signal
sell_signal = ta.crossunder(ma1, ma2) or ta.crossunder(macd, signal)

// Reset signals at the start of each new day
if (newDay)
    buy_signal := false
    sell_signal := false

// Plot Buy/Sell Signals
plotshape(buy_signal, title="Buy Signal", location=location.belowbar, color=color.green, style=shape.labelup, text="BUY")
plotshape(sell_signal, title="Sell Signal", location=location.abovebar, color=color.red, style=shape.labeldown, text="SELL")

// Strategy Entry/Exit
if (buy_signal)
    strategy.entry("Buy", strategy.long)

if (sell_signal)
    strategy.close("Buy", comment="Sell")