Dynamic Exit Trading System Based on Bollinger Bands Application

Overview
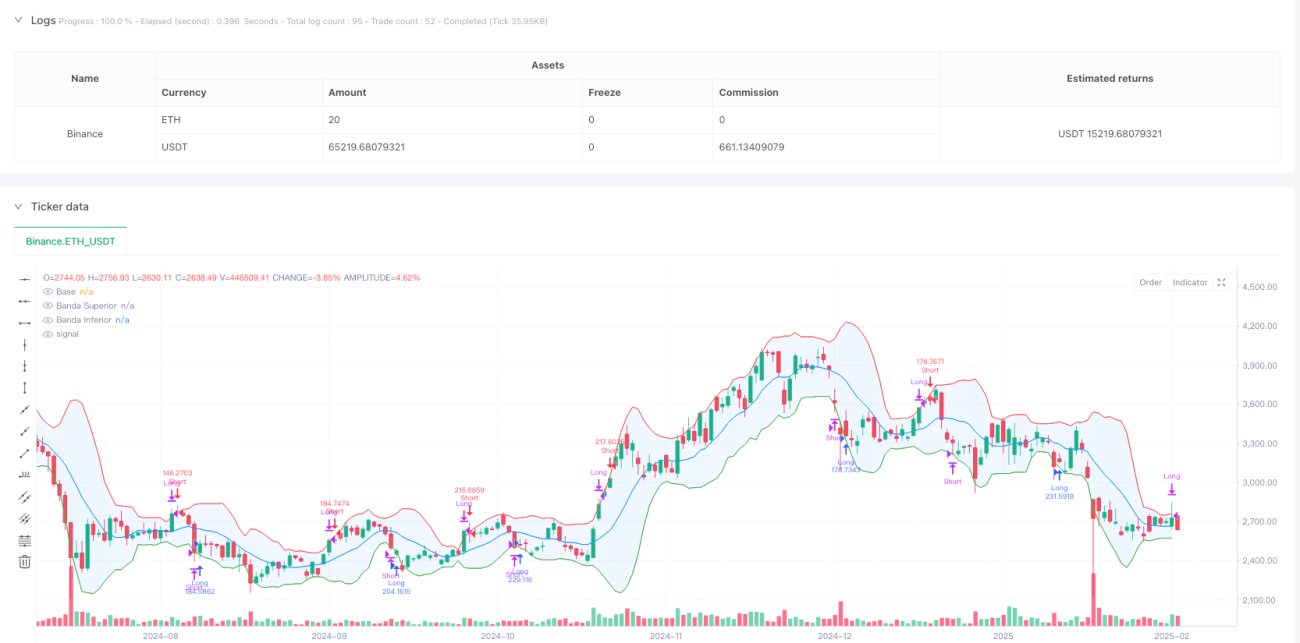
This strategy is a dynamic trading system based on the Bollinger Bands indicator, primarily generating trading signals through price crossovers with Bollinger Bands and using price touches of band boundaries as dynamic exit conditions. The strategy effectively utilizes Bollinger Bands as price volatility ranges, seeking trading opportunities when prices deviate from the mean and employing dynamic exit mechanisms to protect profits and control risks.
Strategy Principles
The core logic includes the following key elements:
- Entry Signal Generation: Long positions are opened when the closing price crosses above the lower band; short positions are opened when the closing price crosses below the upper band.
- Exit Signal Generation: For long positions, automatic closure occurs when the candle's high touches or exceeds the upper band; for short positions, closure happens when the candle's low touches or falls below the lower band.
- Parameter Settings: Bollinger Bands period is set to 10, with a standard deviation multiplier of 2.0, these parameters can be optimized based on the actual trading instrument and timeframe.
Strategy Advantages
- Dynamic Risk Management: Through the adaptive nature of Bollinger Bands, the strategy automatically adjusts trading ranges based on market volatility conditions.
- Clear Trading Rules: Entry and exit conditions are based on objective technical indicators, avoiding uncertainty from subjective judgment.
- Visual Operation: The strategy displays clear trading ranges and signals on charts, facilitating intuitive understanding and monitoring.
- Flexible Position Management: The strategy employs percentage-based position management, beneficial for dynamic capital adjustment.
Strategy Risks
- Choppy Market Risk: In sideways markets, frequent breakout signals may lead to false breakout trades.
- Insufficient Trend Following: As the strategy is designed for reversal trading, it may miss some opportunities in strong trend markets.
- Parameter Sensitivity: Bollinger Bands parameter settings significantly impact strategy performance, different market environments may require different parameter combinations.
Strategy Optimization Directions
- Introduce Trend Filters: Add long-term moving averages or trend indicators to filter counter-trend signals.
- Optimize Exit Mechanism: Design more flexible exit conditions by incorporating other technical indicators or price action characteristics.
- Enhance Volatility Adaptation: Consider dynamically adjusting Bollinger Bands parameters in different volatility environments to improve strategy adaptability.
- Refine Position Management: Dynamically adjust position sizes based on market volatility and signal strength.
Summary
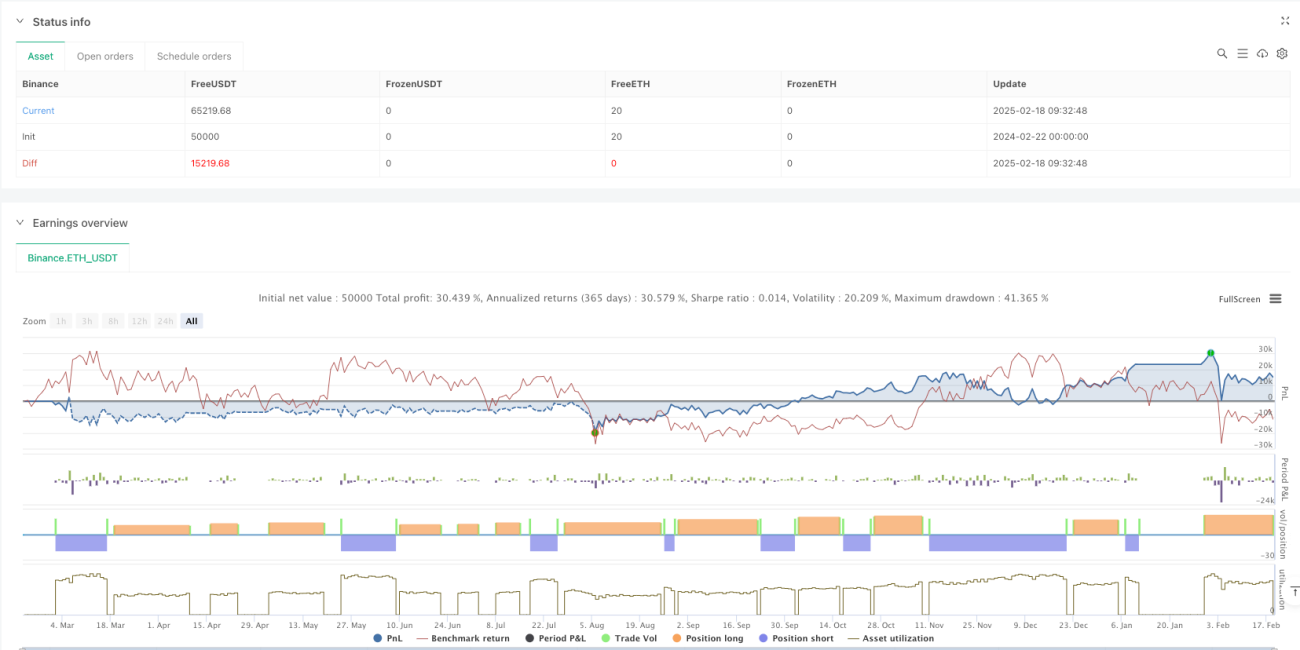
This strategy constructs a complete trading system using Bollinger Bands, featuring clear trading logic and risk management mechanisms. While some potential risks exist, appropriate parameter optimization and strategy improvements can further enhance its performance across different market environments. The strategy's core advantage lies in its dynamic adaptation to market volatility, making it particularly suitable for highly volatile market conditions.
- 1