Support Level and Trend EMA Based Long Strategy

Overview
This is a long-only strategy based on support levels and trend EMA. The strategy identifies optimal entry points by recognizing market trends and key support levels, combining ATR-based dynamic stop-loss and staged profit-taking for risk management. It focuses on price pullbacks to support levels during uptrends and aims to achieve high success rates through reasonable risk-reward ratios.
Strategy Principle
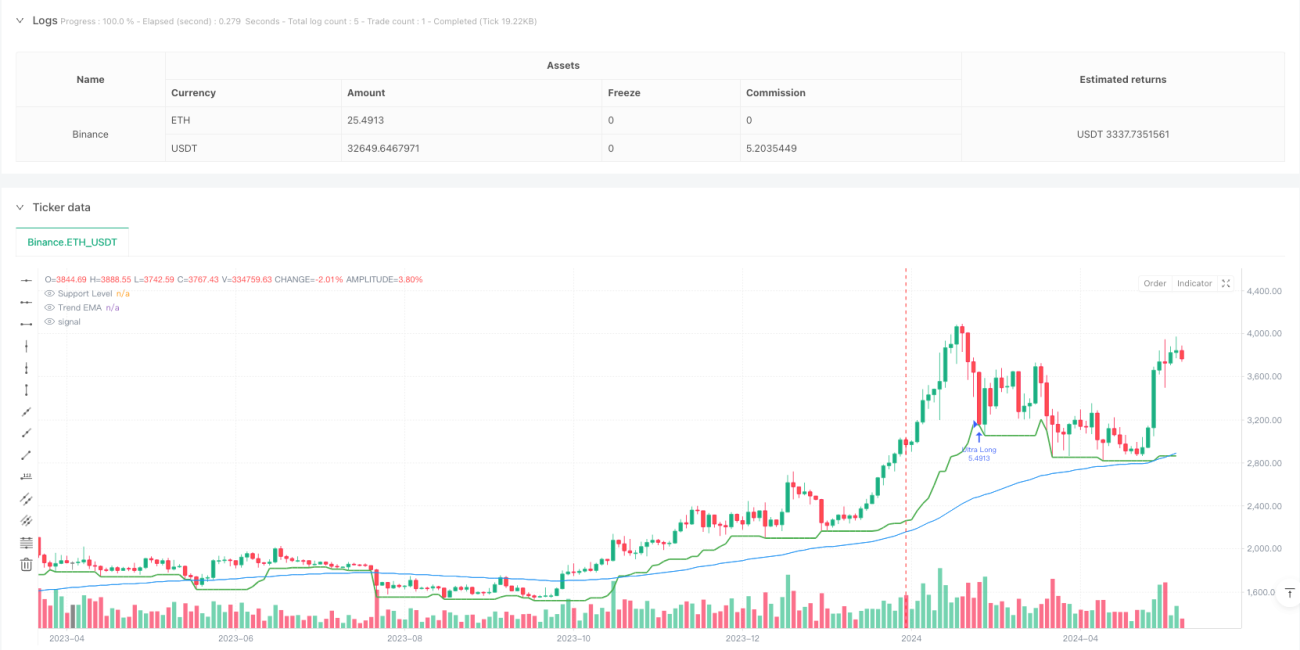
The strategy uses a 100-period EMA as a trend indicator, confirming an uptrend when price is above EMA. It calculates 10-period lows as short-term support levels and looks for entry opportunities when price pulls back near support (support + 0.5*ATR). After entry, it implements staged profit-taking, closing 50% position at 5x ATR and the remainder at 10x ATR, with a 1x ATR dynamic stop-loss. Risk is controlled within 3% of account equity per trade through dynamic position sizing.
Strategy Advantages
- Trend-following characteristics: Uses EMA for trend identification, avoiding counter-trend trades
- Dynamic support levels: Uses recent 10-period lows as support, better reflecting current market conditions
- Flexible risk management: ATR-based dynamic stop-loss and profit targets, adapting to market volatility
- Staged profit-taking: Gradual position closure at different price levels, securing profits while maintaining upside potential
- Precise position sizing: Dynamic calculation based on stop-loss distance, achieving quantified risk management
Strategy Risks
- False breakout risk: Potential false signals near support levels, additional confirmation indicators recommended
- Trend reversal risk: EMA lag may cause losses at trend turning points
- Overtrading risk: Frequent support level triggers may lead to excessive trading
- Slippage risk: Significant slippage possible during volatile periods
Solutions:
- Add trend confirmation indicators
- Optimize entry conditions
- Set trading interval restrictions
- Adjust stop-loss ranges
Strategy Optimization Directions
- Multi-dimensional trend analysis: Incorporate multiple timeframe trend indicators for improved accuracy
- Entry condition optimization: Add volume, volatility, and other auxiliary indicators as entry filters
- Dynamic parameter optimization: Adaptive parameter adjustment based on market conditions
- Market sentiment integration: Include VIX and other sentiment indicators to optimize timing
- Enhanced profit-taking: Dynamic adjustment of profit targets based on market volatility
Summary
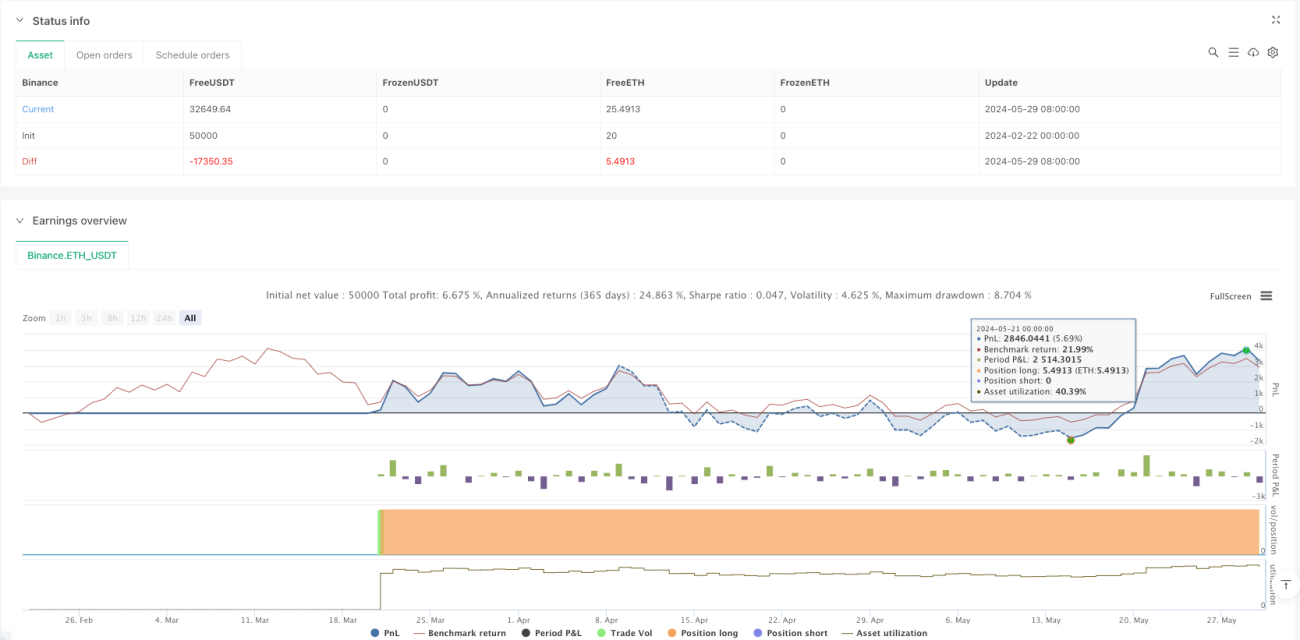
The strategy establishes a complete trading system by combining trend following and support level pullbacks, implementing risk management through staged profit-taking and dynamic stop-loss. Its core strengths lie in comprehensive risk control mechanisms and clear trading logic, but continuous optimization of parameters and entry conditions is needed for different market environments. Traders are advised to conduct thorough backtesting before live implementation and make personalized adjustments based on market experience.
- 1