
Overview
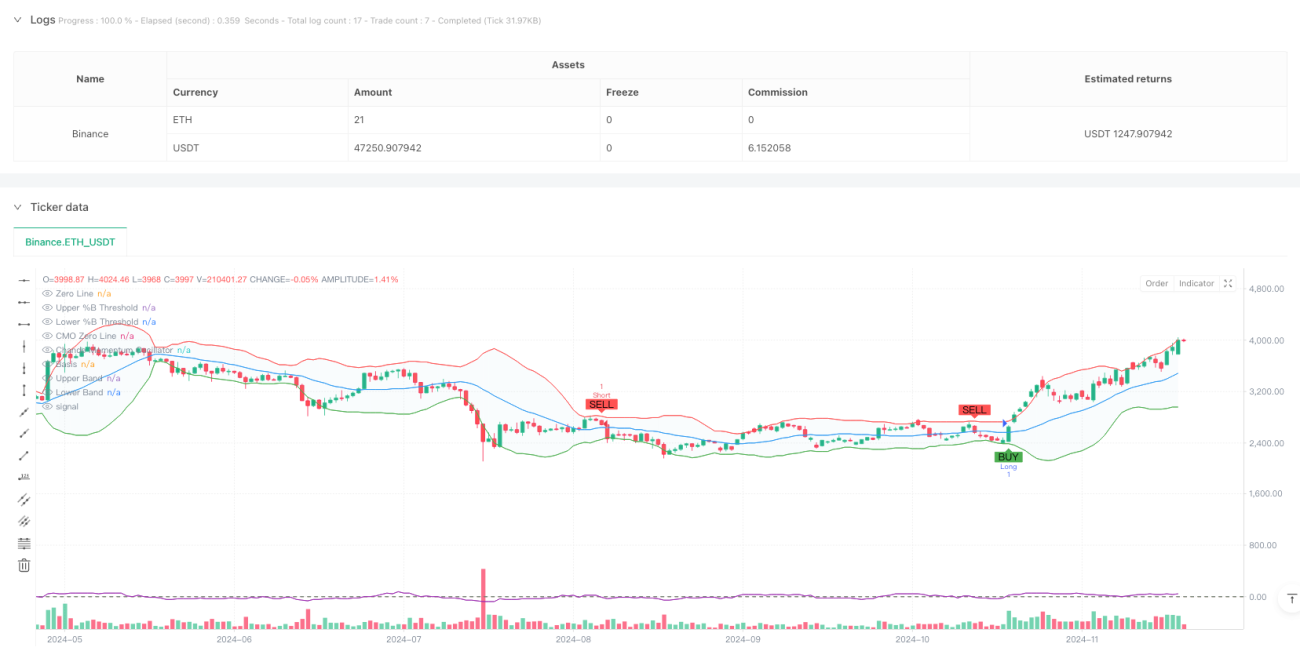
This strategy is a trend trading system that combines the Chande Momentum Oscillator (CMO) and Bollinger Bands percentage indicator (%B). It captures market trend breakthrough opportunities by analyzing changes in price momentum and volatility. The core idea is to trade when price approaches Bollinger Band boundaries and momentum reverses, aiming to establish positions at the beginning of trends for potential significant profits.
Strategy Principles
The strategy utilizes two main technical indicators:
- Bollinger Bands Percentage (%B): Determines overbought/oversold conditions by calculating price's relative position within Bollinger Bands. %B below 0.2 suggests price near lower band, potential rebound; %B above 0.8 suggests price near upper band, potential pullback.
- Chande Momentum Oscillator (CMO): Measures price momentum by calculating the difference between up and down moves. CMO turning positive indicates momentum shift to bullish, turning negative indicates shift to bearish.
Trading Signal Logic:
- Long Entry: When %B crosses above 0.2 and CMO crosses above 0
- Short Entry: When %B crosses below 0.8 and CMO crosses below 0
Strategy Advantages
- High Signal Reliability: Effectively filters false signals by combining momentum and volatility dimensions
- Excellent Risk-Reward Ratio: Early trend entry enables larger profit potential
- Strong Adaptability: Works in various market conditions, capturing both trends and range-bound profits
- Adjustable Parameters: Traders can customize Bollinger Bands and CMO parameters for different instruments
- Clear Visualization: Provides intuitive graphical interface for analysis and judgment
Strategy Risks
- False Breakthrough Risk: Market may generate false breakthrough signals leading to losses
- Slippage Risk: May face significant slippage during intense volatility
- Trend Reversal Risk: Sudden market reversals may prevent timely stop-loss
- Parameter Optimization Risk: Over-optimization may lead to poor live trading performance
- Market Environment Dependency: Strategy may underperform in certain market conditions
Risk Control Suggestions:
- Set reasonable stop-loss levels
- Control position sizing
- Regular parameter review and adjustment
- Cross-validate with other technical indicators
Strategy Optimization Directions
- Introduce Trend Filters: Add moving averages to confirm overall trend direction
- Improve Stop Loss/Profit Mechanism: Design dynamic exit strategies for better capital efficiency
- Optimize Parameter Adaptation: Automatically adjust Bollinger Bands and CMO parameters based on market volatility
- Add Volume Analysis: Incorporate volume indicators to validate breakouts
- Include Time Filters: Avoid trading during low volatility periods
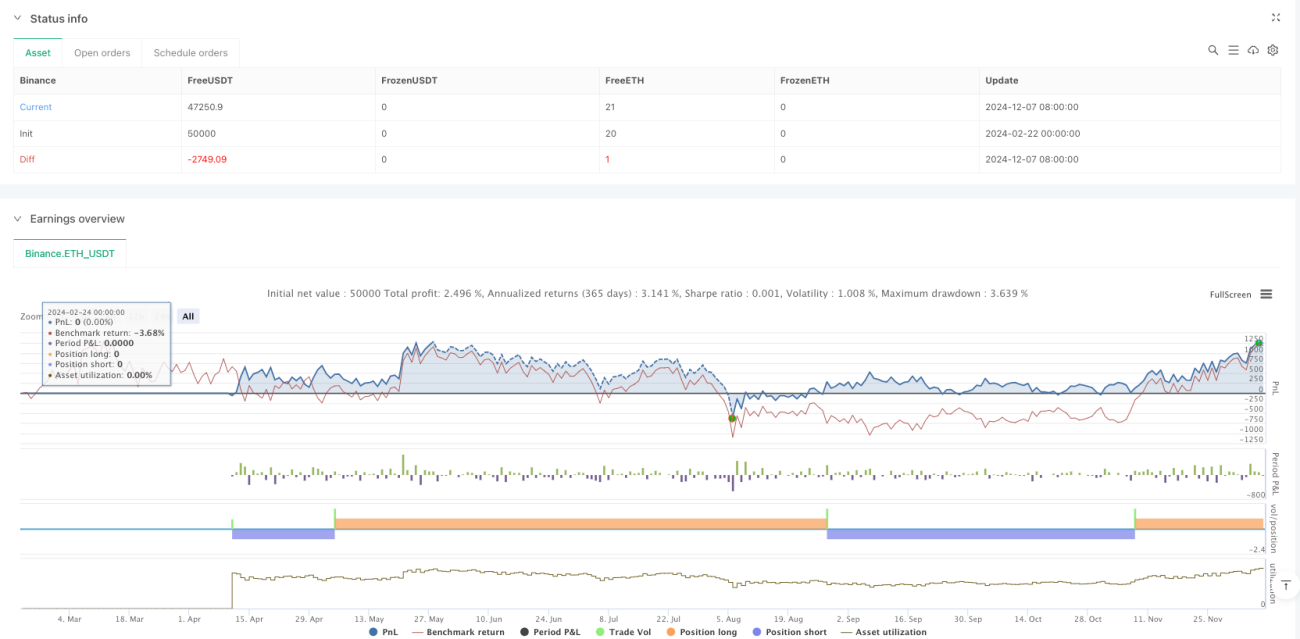
Summary
This is a systematic trading strategy based on technical analysis, capturing market trend opportunities by combining momentum and volatility indicators. The strategy is well-designed with strong practicality and scalability. Through proper risk control and continuous optimization, it can provide stable profit opportunities for traders. It is recommended that traders conduct thorough backtesting and parameter optimization before live trading, and make appropriate adjustments based on specific trading instrument characteristics.
- 1