Adaptive Multi-Indicator Strategy Combining Trend Following and Range Trading

supertrend EMA ADX RSI BB VWAP DMI SMA ATR HLC3
Created on: 2025-02-21 11:08:52 Modified on: 2025-02-21 11:08:52
Copy: 1 Number of hits: 372
avatar of ianzeng123 ianzeng123
2
Follow
319
Followers

 Adaptive Multi-Indicator Strategy Combining Trend Following and Range Trading  Adaptive Multi-Indicator Strategy Combining Trend Following and Range Trading

Overview

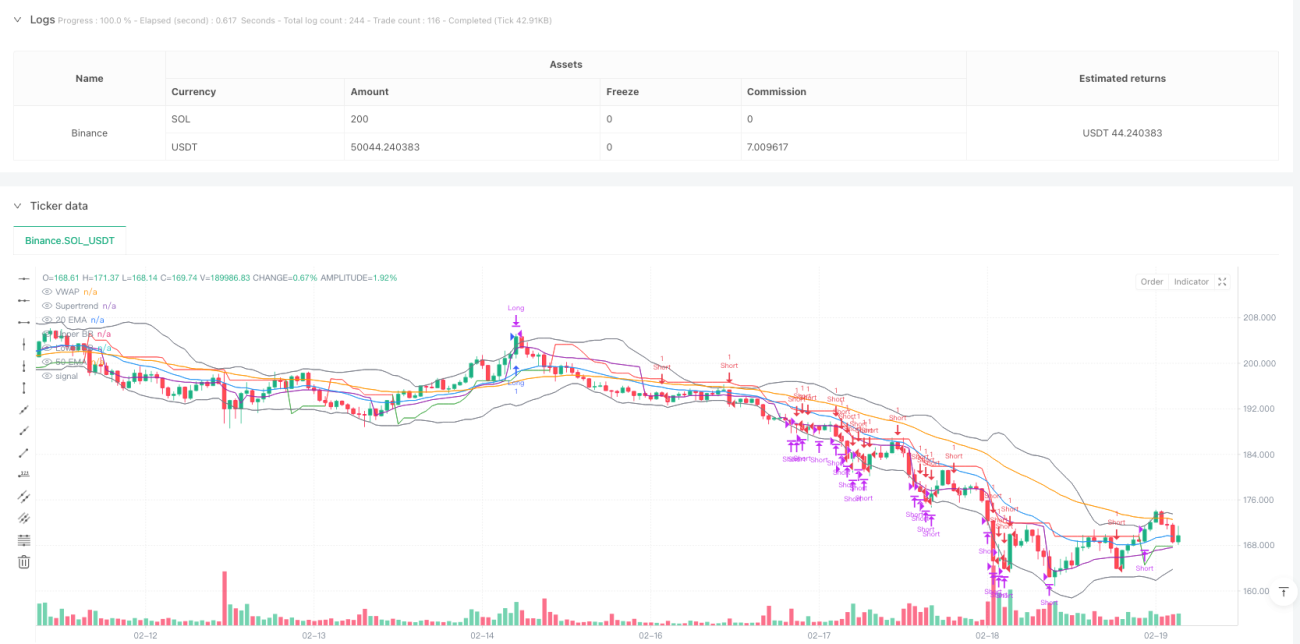
This strategy is an adaptive trading system that combines trend following and range trading approaches. It flexibly switches between trading modes in different market environments through the coordination of multiple technical indicators. The strategy utilizes Supertrend, moving averages, ADX, RSI, and Bollinger Bands to identify market conditions and determine trading signals, while incorporating VWAP for price reference and implementing stop-loss mechanisms for risk control.

Strategy Principles

The core logic is divided into two parts: trend following and range trading. In trending markets (determined by ADX>25), the strategy generates signals based on Supertrend direction, EMA crossovers, and VWAP position; in ranging markets, it trades using Bollinger Band boundaries and RSI overbought/oversold levels. Specifically: - Trend Following Mode: Activated when ADX>25, combining 2050 period EMA relationships, Supertrend direction, and price position relative to VWAP - Range Trading Mode: Activated when ADX<25, entering positions when price touches Bollinger Band boundaries and RSI reaches extreme values - Exit conditions include: stop-loss triggers, Supertrend reversals, or RSI extreme values

Strategy Advantages

  1. Strong adaptability: Automatically switches trading modes based on market conditions
  2. Multiple confirmations: Uses multiple indicators for cross-validation, improving signal reliability
  3. Comprehensive risk control: Implements fixed percentage stop-loss and dynamic RSI-based adjustments
  4. Versatility: Captures both trending and ranging market opportunities
  5. Visual support: Provides graphical display of important indicators for analysis and decision-making

Strategy Risks

  1. Parameter sensitivity: Strategy performance depends on multiple indicator settings
  2. Signal lag: Technical indicators have inherent time delays
  3. False breakout risk: May generate false signals in sideways markets
  4. Computational complexity: Real-time calculation of multiple indicators may affect execution efficiency
  5. Market adaptability: May underperform in certain market conditions

Optimization Directions

  1. Dynamic parameter adjustment: Automatically adjust indicator parameters based on volatility
  2. Volume analysis integration: Add volume indicators to validate signal effectiveness
  3. Stop-loss optimization: Consider implementing ATR-based dynamic stop-loss
  4. Time filtering: Add trading time windows to avoid inefficient periods
  5. Market sentiment indicators: Integrate sentiment indicators to improve prediction accuracy

Summary

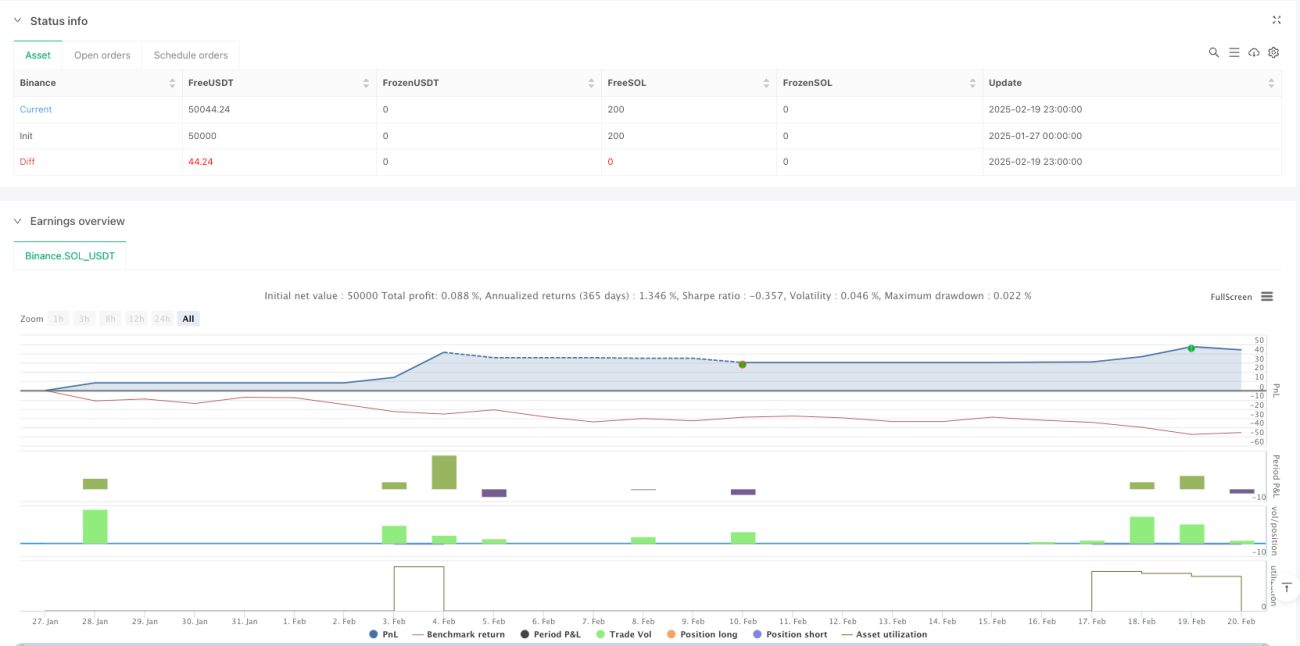
This is a well-designed, logically complete comprehensive strategy. Through multiple indicator coordination and mode switching, it maintains adaptability across different market conditions. While there are some potential risks, with proper risk control and continuous optimization, the strategy has good practical application value. It is recommended to perform thorough parameter optimization and backtesting before live implementation.

Strategy source code
/*backtest
start: 2025-01-27 00:00:00
end: 2025-02-20 00:00:00
period: 1h
basePeriod: 1h
exchanges: [{"eid":"Binance","currency":"SOL_USDT"}]
*/

//@version=5
strategy("Nifty/BankNifty Multi-Strategy v2", overlay=true, margin_long=100, margin_short=100)

// ———— Inputs ———— //
// Supertrend
atrPeriod = input.int(10, "ATR Period")
supertrendMultiplier = input.float(2.0, "Supertrend Multiplier", step=0.1)

// EMA
ema20Period = input.int(20, "20 EMA Period")
ema50Period = input.int(50, "50 EMA Period")

// ADX/DMI
adxThreshold = input.int(25, "ADX Trend Threshold")
adxLength = input.int(14, "ADX Length")

// RSI
rsiLength = input.int(14, "RSI Length")
rsiOverbought = input.int(70, "RSI Overbought")
rsiOversold = input.int(30, "RSI Oversold")

// Bollinger Bands
bbLength = input.int(20, "BB Length")
bbStdDev = input.float(2.0, "BB Std Dev", step=0.1)

// Stop-Loss
stopLossPerc = input.float(1.0, "Stop-Loss %", step=0.1)

// ———— Calculations ———— //
// Supertrend
[supertrend, direction] = ta.supertrend(supertrendMultiplier, atrPeriod)

// EMAs
ema20 = ta.ema(close, ema20Period)
ema50 = ta.ema(close, ema50Period)

// ADX via DMI (corrected)
[dip, din, adx] = ta.dmi(adxLength, adxLength) // ta.dmi(diLength, adxSmoothing)

// RSI
rsi = ta.rsi(close, rsiLength)

// Bollinger Bands
basis = ta.sma(close, bbLength)
upperBB = basis + ta.stdev(close, bbLength) * bbStdDev
lowerBB = basis - ta.stdev(close, bbLength) * bbStdDev

// VWAP
vwapValue = ta.vwap(hlc3)

// ———— Strategy Logic ———— //
trendingMarket = adx > adxThreshold

// Trend-Following Strategy
emaBullish = ema20 > ema50
priceAboveVWAP = close > vwapValue

longConditionTrend = trendingMarket and direction < 0 and emaBullish and priceAboveVWAP
shortConditionTrend = trendingMarket and direction > 0 and not emaBullish and close < vwapValue

// Range-Bound Strategy
priceNearLowerBB = close <= lowerBB
priceNearUpperBB = close >= upperBB

longConditionRange = not trendingMarket and priceNearLowerBB and rsi < rsiOversold
shortConditionRange = not trendingMarket and priceNearUpperBB and rsi > rsiOverbought

// ———— Entries/Exits ———— //
if (longConditionTrend or longConditionRange)
    strategy.entry("Long", strategy.long)
    stopPriceLong = strategy.position_avg_price * (1 - stopLossPerc / 100)
    strategy.exit("Exit Long", "Long", stop=stopPriceLong)

if (shortConditionTrend or shortConditionRange)
    strategy.entry("Short", strategy.short)
    stopPriceShort = strategy.position_avg_price * (1 + stopLossPerc / 100)
    strategy.exit("Exit Short", "Short", stop=stopPriceShort)

// Exit on Supertrend flip or RSI extremes
if (direction > 0 or rsi >= rsiOverbought)
    strategy.close("Long")

if (direction < 0 or rsi <= rsiOversold)
    strategy.close("Short")

// ———— Visualization ———— //
plot(supertrend, "Supertrend", color = direction < 0 ? color.green : color.red)
plot(ema20, "20 EMA", color.blue)
plot(ema50, "50 EMA", color.orange)
plot(vwapValue, "VWAP", color.purple)
plot(upperBB, "Upper BB", color.gray)
plot(lowerBB, "Lower BB", color.gray)