Multi-Indicator Momentum Trend Following Strategy: Quantitative Trading System Based on Supertrend and ADX Dual Confirmation

Overview
This strategy is a trend-following system that combines multiple technical indicators, primarily based on Supertrend indicator for trend direction determination, integrated with ADX (Average Directional Index) for trend strength confirmation and RSI (Relative Strength Index) for volatility range assessment to optimize entry timing. The strategy adopts a long-only mode, utilizing multiple indicator cross-validation to enhance trading accuracy and reliability.
Strategy Principles
The core logic of the strategy is based on three key components:
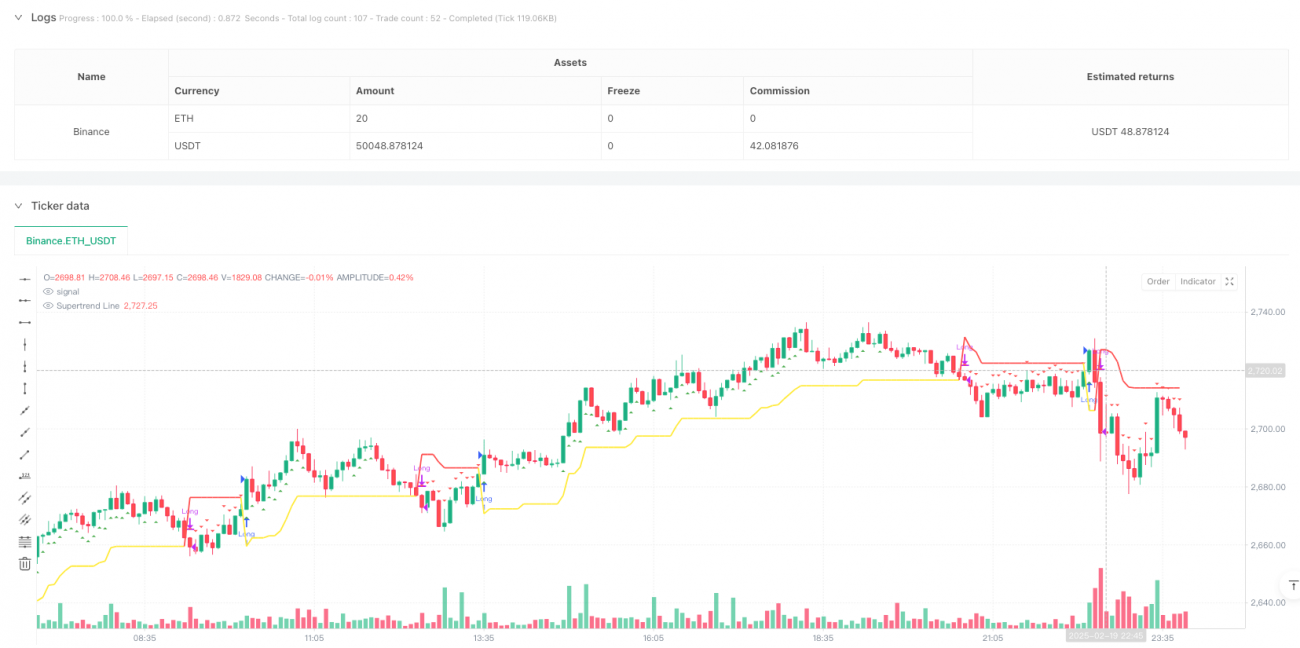
- Supertrend indicator for determining the main trend direction, with a downward shift indicating an uptrend formation;
- ADX indicator for measuring trend strength, with values above 14 indicating sufficient trend momentum;
- RSI indicator for assessing price volatility range, entering between 30-60 to avoid excessive chasing.
Entry conditions must simultaneously satisfy:
- Supertrend direction downward (supertrendDirection == -1)
- ADX value above threshold 14 (adx > adxThreshold)
- RSI within specified range (rsi < 40 or rsi > 60)
Exit conditions:
Position closure is executed when Supertrend direction turns upward (supertrendDirection == 1).
Strategy Advantages
- Multiple indicator cross-validation enhances trading signal reliability, reducing false breakout risks.
- Dual confirmation mechanism combining trend direction and strength better captures trend trading opportunities.
- RSI range restriction prevents entry in overbought areas, improving entry point value.
- Clear strategy logic with adjustable parameters facilitates optimization for different market characteristics.
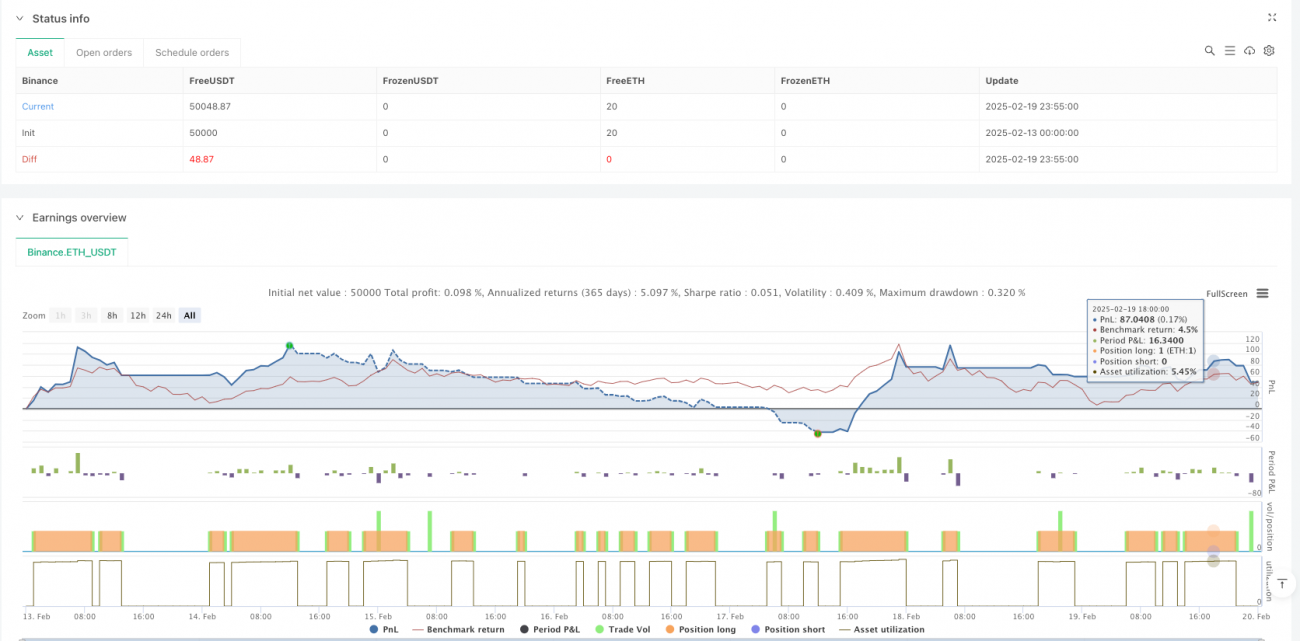
- Comprehensive visualization and alert functions aid real-time strategy monitoring.
Strategy Risks
- Multiple indicators may lead to signal lag, missing trading opportunities in rapidly volatile markets.
- Long-only strategy cannot profit in downtrends, presenting significant directional risk.
- Fixed ADX threshold may perform inconsistently across different market environments.
- RSI range settings might miss important trend initiation points.
- Supertrend parameter sensitivity may generate excessive false signals.
Strategy Optimization Directions
- Introduce adaptive ADX threshold settings, dynamically adjusting thresholds based on market volatility.
- Add trend confirmation time period requirements to avoid short-term false breakouts.
- Optimize RSI range dynamic adjustment mechanism to improve entry timing accuracy.
- Consider adding short functionality to enhance full market adaptability.
- Introduce stop-loss mechanism to control single trade risk.
- Add volume analysis indicators to increase signal credibility.
Summary
This strategy constructs a relatively comprehensive trend-following trading system through the combined application of multiple technical indicators. The core advantage lies in enhancing trading signal reliability through cross-validation of different indicators, while simultaneously facing challenges of signal lag and parameter optimization. Through the proposed optimization directions, the strategy has the potential to further improve its adaptability and stability while maintaining existing advantages. Overall, this is a strategy with a solid basic framework that, through continuous optimization and improvement, has the potential to develop into a more comprehensive and robust trading system.
- 1