Overview
This strategy is a multi-dimensional trading system that combines the Relative Strength Index (RSI), 125-day high breakout, and volume filter. It identifies potential trading opportunities by monitoring RSI crossovers in overbought and oversold zones, price breakouts above the 125-day high, and significant volume increases. This multiple confirmation mechanism helps improve the reliability of trading signals.
Strategy Principles
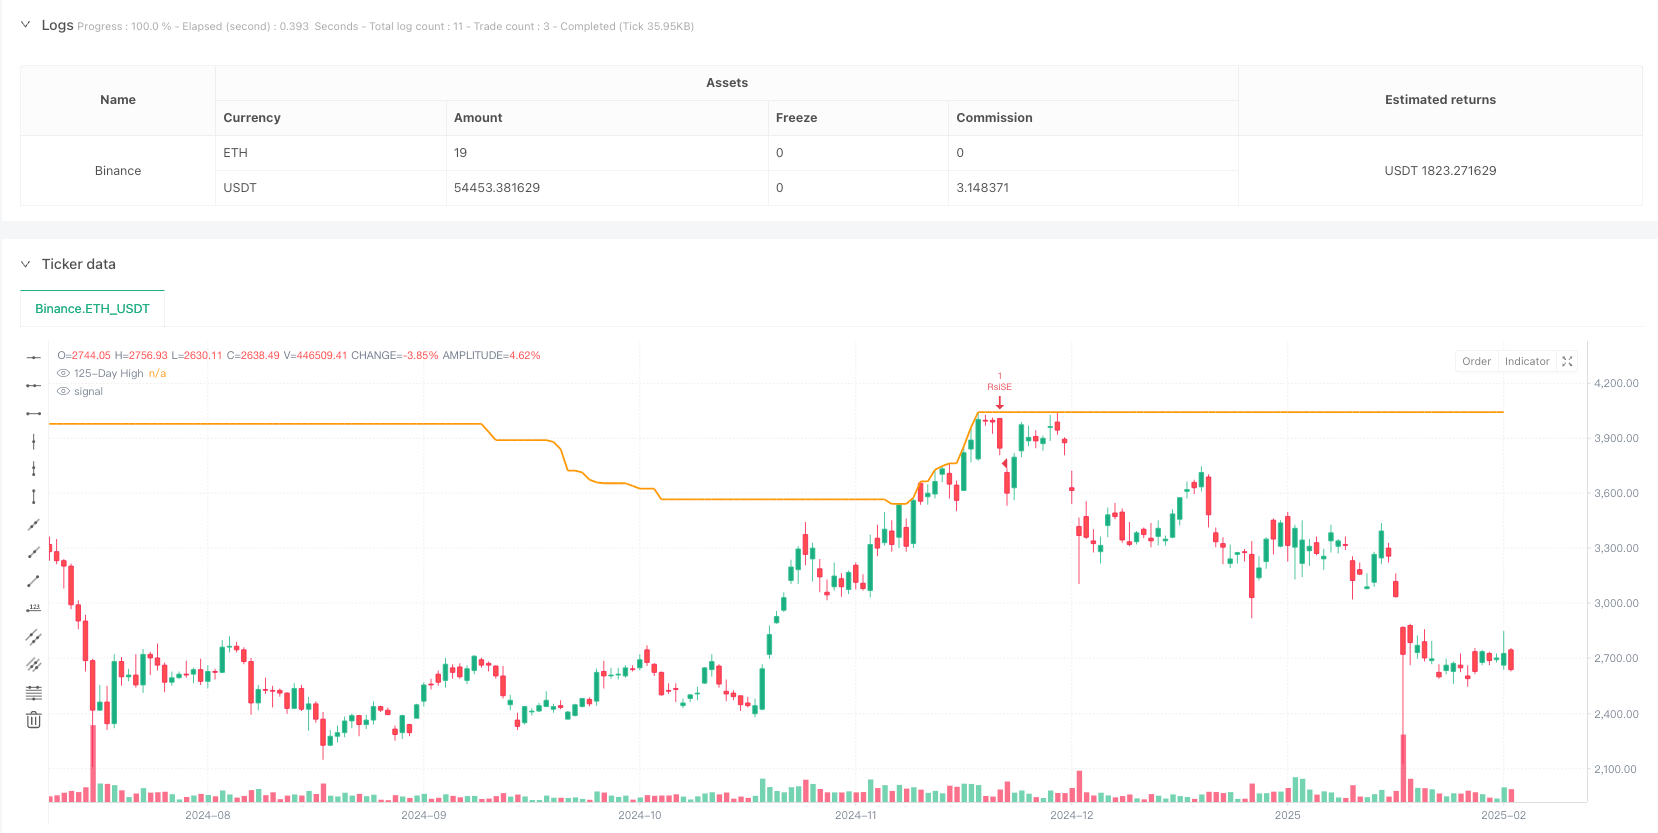
The strategy employs a triple-filter mechanism to confirm trading signals: 1. RSI indicator identifies overbought and oversold areas, generating long signals when RSI breaks up from the oversold zone (below 30) and short signals when breaking down from the overbought zone (above 70). 2. The 125-day high serves as a crucial reference for medium to long-term trends, with price breakouts above this level considered bullish and breakdowns bearish. 3. Volume confirmation requires current volume to be at least twice the previous period’s volume, ensuring sufficient market participation to support price movements.
The strategy only executes trades when all three conditions are simultaneously satisfied.
Strategy Advantages
- Multiple confirmation mechanisms significantly reduce the risk of false signals and improve trading accuracy.
- The volume filter ensures trades occur in environments with adequate market liquidity.
- Using the 125-day high helps capture medium to long-term trend turning points.
- RSI application enables timely identification of overbought and oversold opportunities for price corrections.
- The strategy logic is clear with adjustable parameters, suitable for different market environments.
Strategy Risks
- May generate excessive trading signals in sideways markets, increasing transaction costs.
- Volume conditions might be difficult to meet in low-liquidity instruments, leading to missed opportunities.
- 125-day high tracking may produce lagging responses in volatile markets.
- RSI indicator might generate frequent overbought/oversold signals in strong trends.
- Multiple filter conditions could result in missing some potential trading opportunities.
Strategy Optimization Directions
- Introduce adaptive volume multiplier thresholds that dynamically adjust based on market volatility.
- Consider adding trend filters with different parameter settings for various trend environments.
- Optimize RSI parameters, potentially using adaptive periods to improve indicator sensitivity.
- Implement stop-loss and take-profit mechanisms to enhance capital management effectiveness.
- Consider adding time filters to avoid trading during highly volatile market opening and closing periods.
Summary
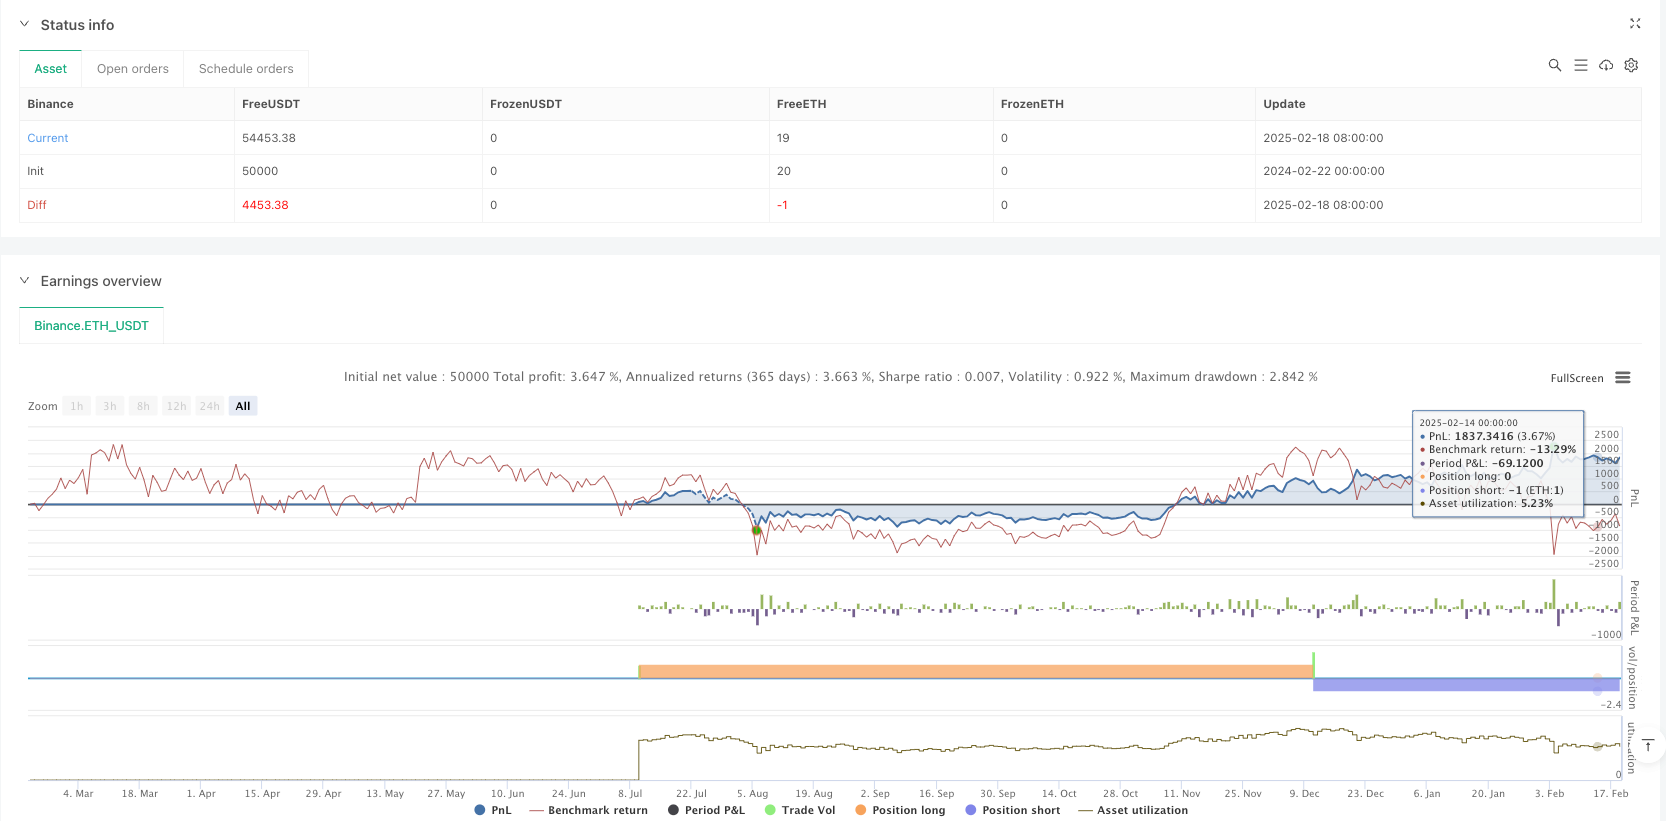
This strategy builds a relatively comprehensive trading system by combining RSI, 125-day high, and volume filters. The multiple confirmation mechanism effectively reduces the risk of false signals, and each component has clear market logic support. Through proper parameter optimization and risk management, this strategy has the potential to achieve stable performance in actual trading.
/*backtest
start: 2024-02-22 00:00:00
end: 2025-02-19 08:00:00
period: 1d
basePeriod: 1d
exchanges: [{"eid":"Binance","currency":"ETH_USDT"}]
*/

//@version=6
strategy("RSI Strategy with 125-Day High and Volume Filter", overlay=true)

// Input variables
length = input(14, title="RSI Length")
overSold = input(30, title="Oversold Level")
overBought = input(70, title="Overbought Level")
price = close

// RSI Calculation
vrsi = ta.rsi(price, length)

// Conditions for RSI crossover
co = ta.crossover(vrsi, overSold)
cu = ta.crossunder(vrsi, overBought)

// 125-day high calculation
high_125 = ta.highest(high, 125)

// Crossing conditions for 125-day high
cross_above_high_125 = ta.crossover(price, high_125)
cross_below_high_125 = ta.crossunder(price, high_125)

// Volume condition: Check if current volume is at least 2 times the previous volume
volume_increased = volume > 2 * volume[1]

// Entry logic for RSI and 125-day high with volume filter
if (not na(vrsi))
    if (co and volume_increased)
        strategy.entry("RsiLE", strategy.long, comment="RsiLE")
    if (cu and volume_increased)
        strategy.entry("RsiSE", strategy.short, comment="RsiSE")

// Entry logic for 125-day high crossing with volume filter
if (cross_above_high_125 and volume_increased)
    strategy.entry("BuyHigh125", strategy.long, comment="BuyHigh125")

if (cross_below_high_125 and volume_increased)
    strategy.entry("SellHigh125", strategy.short, comment="SellHigh125")

// Plot the 125-day high for visualization
plot(high_125, title="125-Day High", color=color.orange, linewidth=2, style=plot.style_line)