Multi-Level ZigZag Percentage Retracement with Stochastic Trading Strategy

ZZ ATR RSI STOCH SMA
Created on: 2025-02-21 11:18:39 Modified on: 2025-02-21 11:18:39
Copy: 0 Number of hits: 477
avatar of ianzeng123 ianzeng123
2
Follow
319
Followers

 Multi-Level ZigZag Percentage Retracement with Stochastic Trading Strategy  Multi-Level ZigZag Percentage Retracement with Stochastic Trading Strategy

Overview

This strategy combines ZigZag percentage retracement with the Stochastic indicator to create a comprehensive trading system. It identifies key market turning points using a dynamically adjusted ZigZag indicator while optimizing entry timing using Stochastic overbought/oversold signals. The system also incorporates stop-loss and take-profit mechanisms for risk management.

Strategy Principles

The core logic is based on several key components: 1. Dynamic ZigZag indicator - Supports manual setting or ATR-based dynamic adjustment of retracement percentage across different periods (5-250) 2. Stochastic filter - Uses 9-period K value with 3-period smoothing 3. Trade signal generation: - 
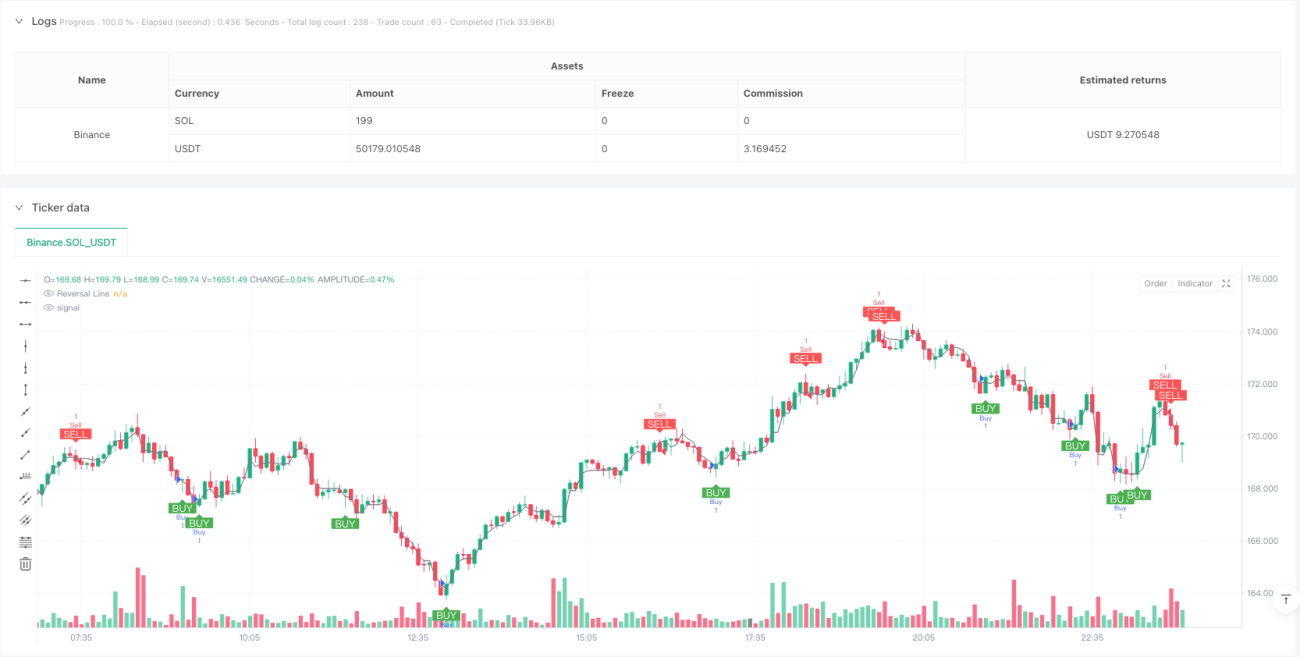
Buy signal: Price breaks above reversal line and Stochastic K value below 20 - Sell signal: Price breaks below reversal line and Stochastic K value above 80 4. Risk management - Fixed point-based stop-loss (100 points) and take-profit (300 points)

Strategy Advantages

  1. High adaptability - ATR-based dynamic adjustment for different market conditions
  2. Multiple confirmations - Combines trend and momentum indicators to reduce false signals
  3. Controlled risk - Comprehensive stop-loss and take-profit mechanisms
  4. Clear signals - Trading signals are distinct and easy to execute
  5. Flexible parameters - Supports multiple customizable parameters for optimization

Strategy Risks

  1. Choppy market risk - May trigger frequent stop-losses in ranging markets
  2. Slippage risk - Potential for significant slippage in fast-moving markets
  3. Fixed stop-loss risk - Fixed point-based stops may not suit all market conditions
  4. False breakout risk - May generate false signals in consolidation zones
  5. Parameter sensitivity - Strategy performance heavily depends on parameter selection

Optimization Directions

  1. Dynamic stop-loss - Consider using ATR or volatility for dynamic stop adjustment
  2. Market environment filter - Add trend strength indicators for strong trend validation
  3. Signal confirmation enhancement - Consider adding volume confirmation
  4. Entry timing optimization - Incorporate price pattern recognition
  5. Position management improvement - Implement volatility-based position sizing

Summary

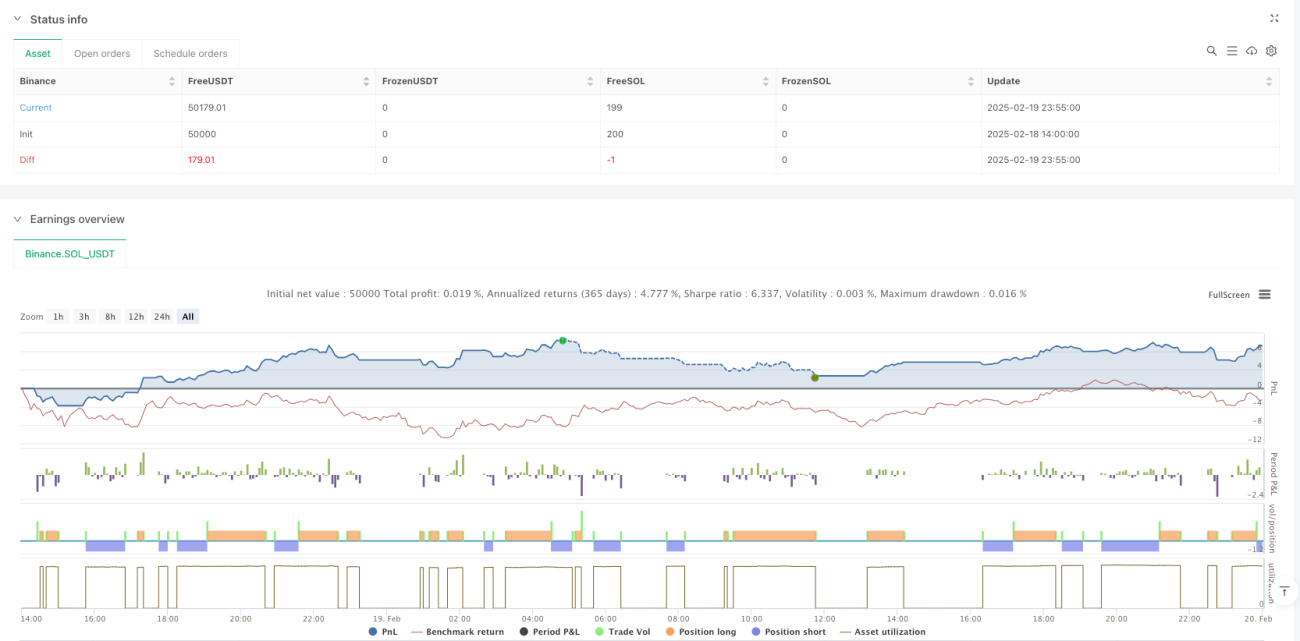
The strategy builds a comprehensive trading system by combining ZigZag and Stochastic indicators. Its main features are clear signals and controlled risk, but it requires parameter optimization based on actual market conditions. It’s recommended to conduct thorough backtesting and make continuous improvements based on market experience before live trading.

Strategy source code
/*backtest
start: 2025-02-18 14:00:00
end: 2025-02-20 00:00:00
period: 5m
basePeriod: 5m
exchanges: [{"eid":"Binance","currency":"SOL_USDT"}]
*/

//@version=5
strategy("[RS]ZigZag Percent Reversal with Stochastic Strategy", overlay=true)

//  ||---}---------------------------------------------------------------------||

//  |--------------------------------------------------------------------------||
//  |   ZigZag:                                                                ||
//  |--------------------------------------------------------------------------||
//  |{
string percent_method = input.string(
         defval="MANUAL", 
         title="Method to use for the zigzag reversal range:", 
         options=[
             "MANUAL", 
             "ATR005 * X", "ATR010 * X", "ATR020 * X", "ATR050 * X", "ATR100 * X", "ATR250 * X"
             ]
         )

var float percent = input.float(
         defval=0.25, 
         title="Percent of last pivot price for zigzag reversal:", 
         minval=0.0, maxval=99.0
         ) / 100

float percent_multiplier = input.float(
         defval=1.0, 
         title="Multiplier to apply to ATR if applicable:"
         )
if percent_method == "ATR005 * X"
    percent := ta.atr(5) / open * percent_multiplier
if percent_method == "ATR010 * X"
    percent := ta.atr(10) / open * percent_multiplier
if percent_method == "ATR020 * X"
    percent := ta.atr(20) / open * percent_multiplier
if percent_method == "ATR050 * X"
    percent := ta.atr(50) / open * percent_multiplier
if percent_method == "ATR100 * X"
    percent := ta.atr(100) / open * percent_multiplier
if percent_method == "ATR250 * X"
    percent := ta.atr(250) / open * percent_multiplier

//  ||-------------------------------------------------------------------------||
//  ||  zigzag function:
//  ||-------------------------------------------------------------------------||
//  |{
f_zz(_percent)=>


    //  direction after last pivot
    var bool _is_direction_up = na
    //  track highest price since last lower pivot
    var float _htrack = na
    //  track lowest price since last higher pivot
    var float _ltrack = na
    //  zigzag variable for plotting
    var float _pivot = na
    //  range needed for reaching reversal threshold
    float _reverse_range = 0.0
    //  real pivot time
    var int _real_pivot_time = na
    var int _htime = na
    var int _ltime = na
    //  reverse line
    var float _reverse_line = na
    
    if bar_index >= 1
        
        if na(_is_direction_up)
            _is_direction_up := true
        
        _reverse_range := nz(_pivot[1]) * _percent
        
        if _is_direction_up
            _ltrack := na
            _ltime := time
            
            if na(_htrack)
                if high > high[1]
                    _htrack := high
                    _htime := time
                else
                    _htrack := high[1]
                    _htime := time[1]
            else
                if high > _htrack
                    _htrack := high
                    _htime := time

            // Reversal line calculation based on the current candle's closing price
            _reverse_line := _htrack - _reverse_range
            
            // If close <= reversal line, mark pivot and reverse direction
            if close <= _reverse_line
                _pivot := _htrack
                _real_pivot_time := _htime
                _is_direction_up := false

        if not _is_direction_up
            _htrack := na
            _htime := na
            
            if na(_ltrack)
                if low < low[1]
                    _ltrack := low
                    _ltime := time
                else
                    _ltrack := low[1]
                    _ltime := time[1]
            else
                if low < _ltrack
                    _ltrack := low
                    _ltime := time
                
            // Reversal line calculation based on the current candle's closing price
            _reverse_line := _ltrack + _reverse_range
            
            // If close >= reversal line, mark pivot and reverse direction
            if close >= _reverse_line
                _pivot := _ltrack
                _real_pivot_time := _ltime
                _is_direction_up := true

    [_pivot, _is_direction_up, _reverse_line, _real_pivot_time]

[pivot, direction_up, reverse_line, pivot_time] = f_zz(percent)

// Çizim
// Sabit Reversal Line (fiyat seviyesinde sabit)
var float static_reverse_line = na
if (not na(reverse_line))
    static_reverse_line := reverse_line

plot(series=static_reverse_line, color=color.gray, style=plot.style_line, title="Reversal Line", trackprice=false)

//  ||-------------------------------------------------------------------------||
//  ||  Stochastic:                                                            ||
//  ||-------------------------------------------------------------------------||
//  |{
K_length = 9
K_smoothing = 3

// Stochastic %K hesaplama
stochK = ta.sma(ta.stoch(close, high, low, K_length), K_smoothing)

//  ||-------------------------------------------------------------------------||
//  ||  Custom Buy/Sell Signals:
//  ||-------------------------------------------------------------------------||
//  |{
// Buy sinyali: Fiyat reversal line'ının üstünde ve stochastic K değeri 20'nin altında ise
buy_signal = close > static_reverse_line and stochK < 20

// Sell sinyali: Fiyat reversal line'ının altındaysa ve stochastic K değeri 80'in üstünde ise
sell_signal = close < static_reverse_line and stochK > 80

// Alım ve satım sinyali için strateji girişlerini ekle
long_condition = buy_signal
short_condition = sell_signal

// **Burada Stop Loss ve Take Profit değerleri ayarlandı**
stop_loss_pips = 100  // Stop Loss 10 pip
take_profit_pips = 300  // Take Profit 30 pip

// Stop Loss ve Take Profit seviyeleri hesaplanıyor
long_stop_loss = close - stop_loss_pips * syminfo.mintick
long_take_profit = close + take_profit_pips * syminfo.mintick
short_stop_loss = close + stop_loss_pips * syminfo.mintick
short_take_profit = close - take_profit_pips * syminfo.mintick

// Long stratejisi: Alım sinyali ve stop loss/take profit seviyeleri ile
if long_condition
    strategy.entry("Buy", strategy.long, stop=long_stop_loss, limit=long_take_profit)
    strategy.exit("Take Profit / Stop Loss", from_entry="Buy", stop=long_stop_loss, limit=long_take_profit)
    // Webhook ile alım bildirimi gönder
    alert("Buy Signal Triggered!", alert.freq_once_per_bar)

// Short stratejisi: Satım sinyali ve stop loss/take profit seviyeleri ile
if short_condition
    strategy.entry("Sell", strategy.short, stop=short_stop_loss, limit=short_take_profit)
    strategy.exit("Take Profit / Stop Loss", from_entry="Sell", stop=short_stop_loss, limit=short_take_profit)
    // Webhook ile satım bildirimi gönder
    alert("Sell Signal Triggered!", alert.freq_once_per_bar)

// Alım sinyali gösterimi
plotshape(series=buy_signal, location=location.belowbar, color=color.green, style=shape.labelup, title="Buy Signal", text="BUY", textcolor=color.white)
// Satım sinyali gösterimi
plotshape(series=sell_signal, location=location.abovebar, color=color.red, style=shape.labeldown, title="Sell Signal", text="SELL", textcolor=color.white)