Adaptive Dynamic Stop-Loss and Take-Profit Strategy Based on EMA Crossover and RSI Filter

Overview
This strategy is a quantitative trading system that combines EMA crossovers, RSI filtering, and ATR-based dynamic stop-loss and take-profit mechanisms. The strategy confirms trend reversal points through the crossover of fast and slow Exponential Moving Averages (EMA), while incorporating the Relative Strength Index (RSI) as a filter to avoid trading in overbought or oversold zones. Its distinctive feature is the use of Average True Range (ATR) to dynamically adjust stop-loss and take-profit levels, allowing risk management parameters to adapt to market volatility.
Strategy Principles
The core logic is based on the following key components:
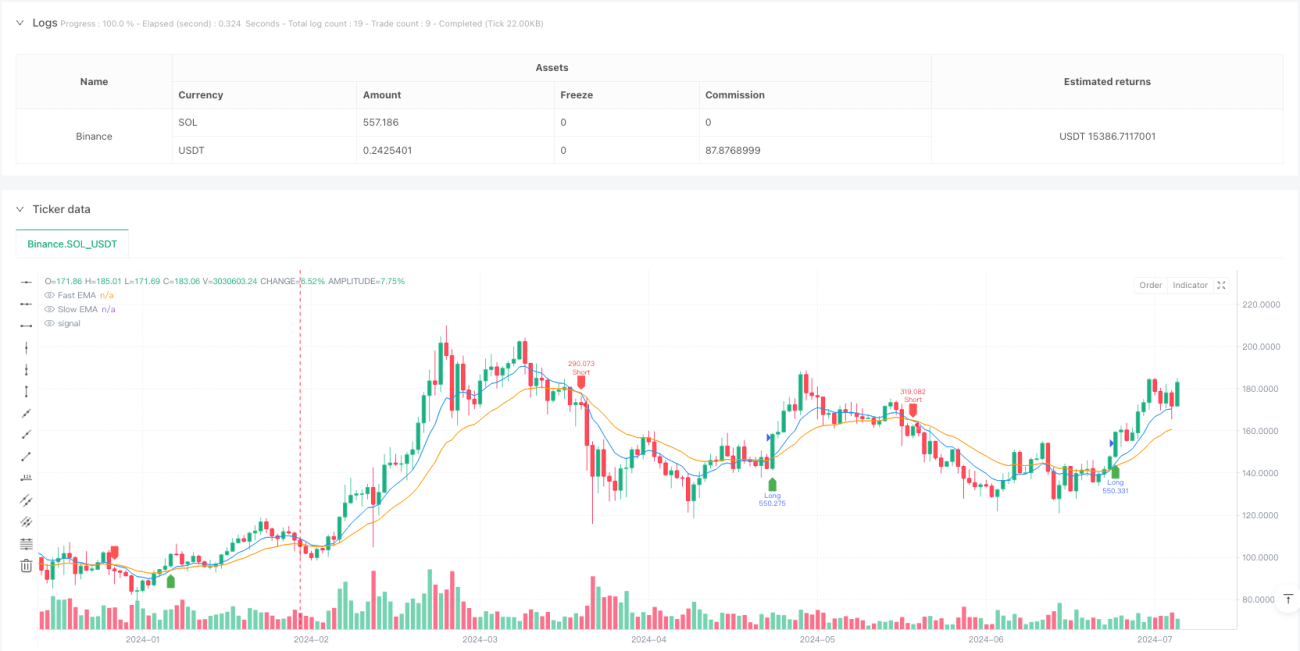
- Trend Identification: Uses 9-period and 21-period EMA crossovers to confirm trend direction changes, with fast line crossing above slow line as bullish signal and vice versa.
- Trade Filtering: Employs 14-period RSI to filter trading signals, executing long positions only when RSI is above 30 (oversold) and short positions when below 70 (overbought).
- Risk Management: Dynamically sets stop-loss and take-profit levels based on 14-period ATR, with stop-loss at 2.5x ATR and take-profit at 5x ATR (2x stop-loss distance), ensuring a 1:2 risk-reward ratio.
Strategy Advantages
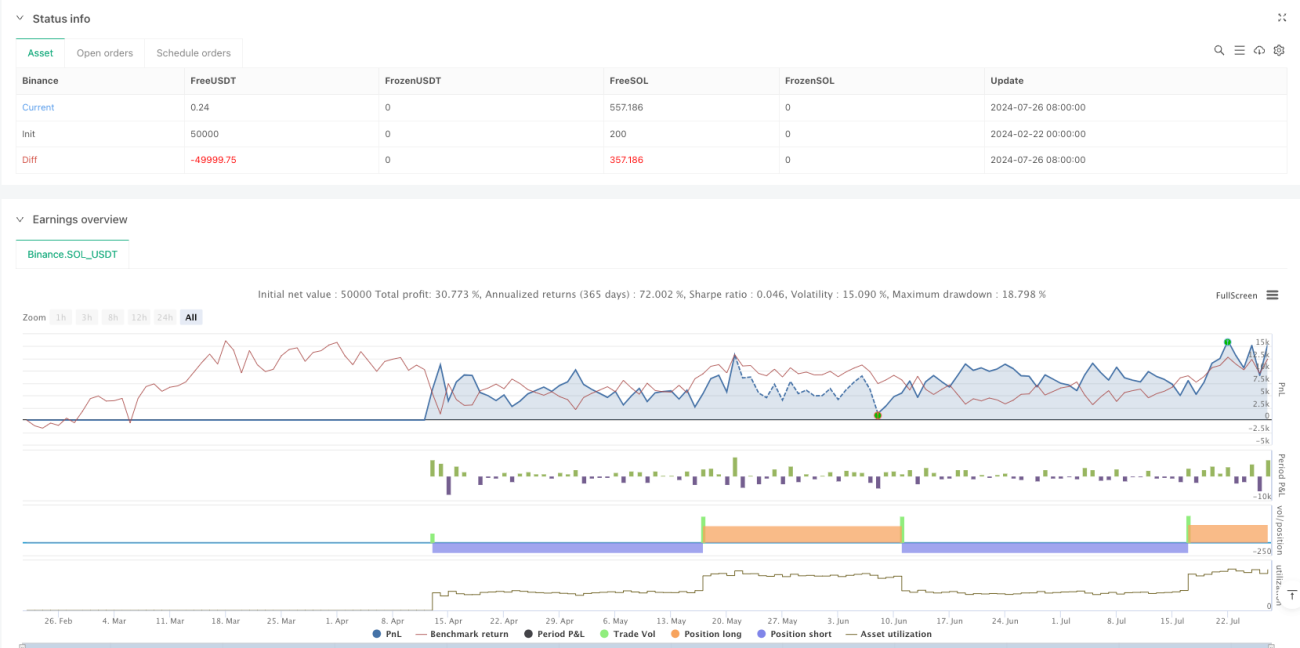
- Dynamic Adaptability: Automatically adjusts stop-loss and take-profit levels through ATR, enabling the strategy to adapt to volatility characteristics in different market environments.
- Multiple Confirmation Mechanism: Combines trend and momentum indicators to reduce the impact of false signals.
- Optimized Risk-Reward Ratio: Employs a 1:2 risk-reward ratio setting, pursuing higher returns while managing risk.
- Visual Support: Provides signal markers and moving average displays for intuitive market condition understanding.
Strategy Risks
- Choppy Market Risk: Frequent EMA crossovers in ranging markets may lead to overtrading.
- Slippage Impact: Significant differences between actual execution prices and signal prices may occur during intense market volatility.
- Parameter Sensitivity: Strategy performance is sensitive to settings like EMA periods, RSI thresholds, and ATR multipliers.
Strategy Optimization Directions
- Market Environment Recognition: Introduce trend strength indicators (like ADX) to use different parameters in strong trend and ranging markets.
- Position Management Optimization: Dynamically adjust position sizes based on RSI and ATR values, increasing positions when signals are stronger.
- Exit Mechanism Improvement: Consider adding trailing stops to protect more profits during trend continuation.
- Time Filtering: Add trading time window restrictions to avoid trading during low volatility periods.
Summary
The strategy constructs a complete trading system by identifying trends through moving averages, filtering false signals with RSI, and managing risk dynamically with ATR. Its main characteristic is strong adaptability, capable of adjusting trading parameters according to market volatility. Through implementation of optimization directions, the strategy's stability and profitability can be further enhanced. It is recommended to conduct thorough historical data backtesting and parameter optimization before live trading.
//@version=6
strategy("High Win Rate Dogecoin Strategy", overlay=true, default_qty_type=strategy.percent_of_equity, default_qty_value=100)

// Input Parameters
fastLength = input(9, title="Fast EMA Length")
slowLength = input(21, title="Slow EMA Length")
atrLength = input(14, title="ATR Length")
atrMultiplier = input(2.5, title="ATR Multiplier")
rsiLength = input(14, title="RSI Length")
rsiOverbought = input(70, title="RSI Overbought")
rsiOversold = input(30, title="RSI Oversold")
- 1