Multi-Indicator Adaptive Trend Trading Strategy

Overview
This strategy is an adaptive trend following trading system that integrates multiple technical indicators. It combines the Moving Average system (EMA), momentum indicator (RSI), trend indicator (MACD), and SuperTrend for signal confirmation, equipped with comprehensive risk management mechanisms including stop-loss, take-profit, and trailing stop functionalities. The strategy design fully considers market volatility, enhancing trading stability and reliability through multiple signal filters and risk controls.
Strategy Principles
The strategy employs a multi-layer signal confirmation mechanism:
- Initial trend direction determined by 9-period and 21-period EMA crossovers
- RSI(14) for overbought/oversold filtering, requiring RSI>40 and <70 for buy signals, RSI<60 and >30 for sell signals
- MACD indicator verifies trend momentum, requiring signal line and MACD line alignment
- SuperTrend indicator provides additional trend confirmation
- Risk control employs 5% stop-loss, 10% take-profit, 2% trailing stop, and 1% breakeven level
Trades are only triggered when all conditions are simultaneously met, effectively reducing false breakout risks.
Strategy Advantages
- Multiple signal confirmation mechanism significantly reduces false signal interference
- Comprehensive risk control system including fixed stops, trailing stops, and breakeven stops
- Strategy demonstrates good adaptability to different market environments
- Clear entry and exit logic, easy to understand and maintain
- Trading logic has solid theoretical foundation, each indicator serves a specific purpose
Strategy Risks
- Multiple signal confirmation may cause missing important trading opportunities
- Fixed stop-loss levels may lack flexibility in highly volatile markets
- Parameter optimization might lead to overfitting historical data
- Multiple indicators may generate conflicting signals in ranging markets
Solutions include: dynamic stop-loss adjustment, volatility indicator integration, regular parameter re-optimization.
Strategy Optimization Directions
- Introduce adaptive parameter mechanisms to dynamically adjust parameters based on market volatility
- Add volume indicators as supplementary confirmation tools
- Optimize stop-loss mechanism by implementing ATR-based dynamic stops
- Include market environment recognition module to use different parameter sets under different market conditions
- Develop machine learning-based parameter optimization system
Summary
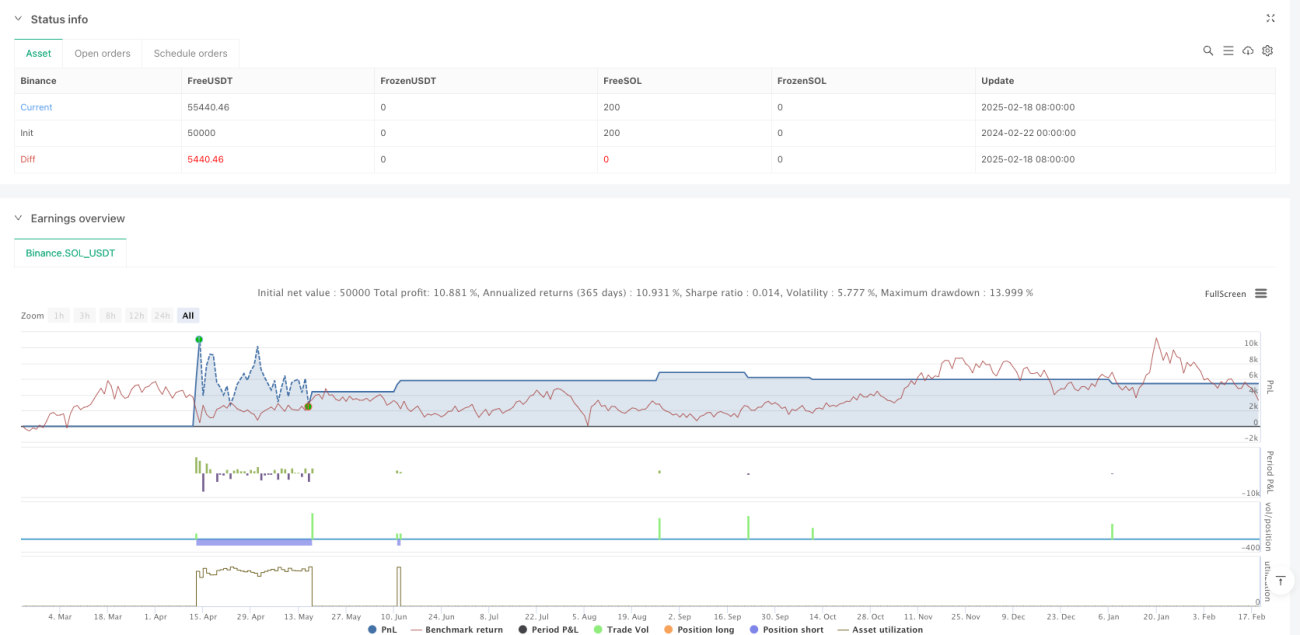
The strategy constructs a robust trading system through multi-dimensional technical indicator collaboration. Its comprehensive risk control mechanism and clear trading logic provide good practicality. While there is room for optimization, the strategy's basic framework has a solid theoretical foundation, and through continuous optimization and improvement, it has the potential to further enhance its trading performance.
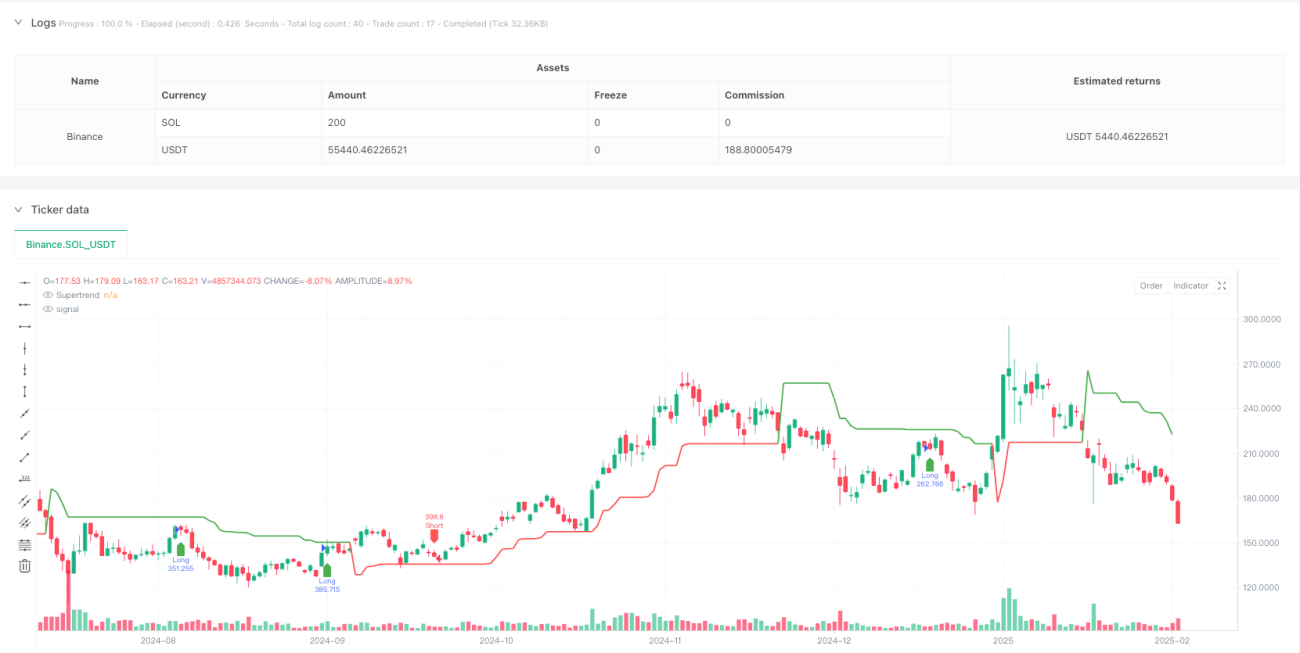
/*backtest
start: 2024-02-22 00:00:00
end: 2025-02-19 08:00:00
period: 1d
basePeriod: 1d
exchanges: [{"eid":"Binance","currency":"SOL_USDT"}]
*/

//@version=5
strategy("Optimized BTC Trading Strategy v2", overlay=true, default_qty_type=strategy.percent_of_equity, default_qty_value=100, commission_type=strategy.commission.percent, commission_value=0.1)

// Input parameters- 1