Momentum Multi-Indicator Trend Following Strategy: Donchian Channel with SuperTrend and Volume Filter Entry System

DC ST MA VOL BO
Created on: 2025-02-21 11:47:17 Modified on: 2025-02-21 11:47:17
Copy: 0 Number of hits: 565
avatar of ianzeng123 ianzeng123
2
Follow
319
Followers

 Momentum Multi-Indicator Trend Following Strategy: Donchian Channel with SuperTrend and Volume Filter Entry System  Momentum Multi-Indicator Trend Following Strategy: Donchian Channel with SuperTrend and Volume Filter Entry System

Overview

This strategy is a trend-following trading system based on Donchian Channel breakouts, incorporating SuperTrend indicator and volume filter to enhance signal reliability. The strategy primarily identifies potential long trading opportunities by capturing price breakouts above historical highs, while using volume confirmation and trend-following indicators to filter false breakout signals. The strategy design is flexible and can be optimized for different market environments and trading instruments.

Strategy Principles

The core logic of the strategy is based on the following key components: 1. 
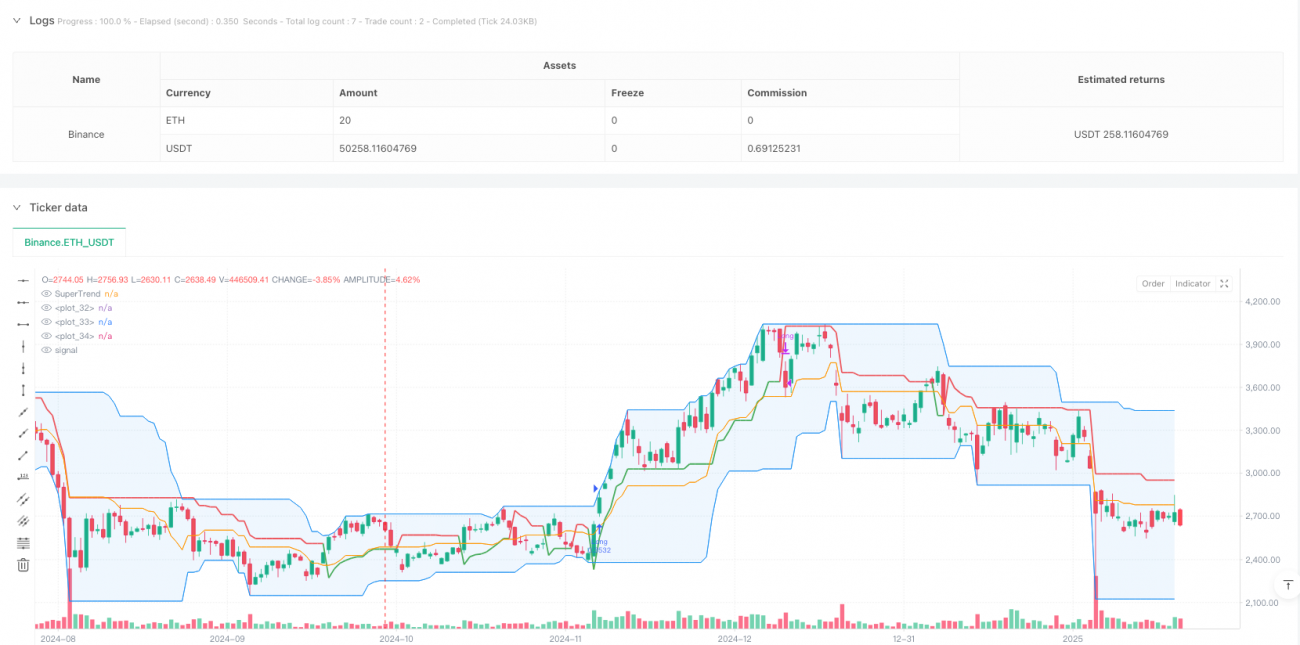
Donchian Channel: Calculates the highest and lowest prices within a user-defined period, forming upper, lower, and middle bands. Long entry signals are triggered when price breaks above the upper band. 2. Volume Filter: Compares current volume with its 20-period moving average to ensure entries only occur during volume expansion, improving breakout reliability. 3. SuperTrend Indicator: Serves as a trend confirmation tool, displaying green during bullish trends and red during bearish trends. 4. Flexible Stop-Loss Mechanism: Offers four different stop-loss options, including lower band stop, middle band stop, SuperTrend stop, and percentage trailing stop.

Strategy Advantages

  1. Multiple Signal Confirmation: Combines price breakouts, volume confirmation, and trend indicators to significantly reduce false breakout risks.
  2. High Adaptability: Can be adapted to different market environments and trading timeframes through parameter adjustment.
  3. Comprehensive Risk Management: Provides multiple stop-loss options to choose the most suitable method based on market characteristics.
  4. Clear Visualization: Strategy interface intuitively displays various indicators, making it easy for traders to understand market conditions.
  5. Flexible Backtesting: Allows customization of backtesting date ranges for strategy optimization.

Strategy Risks

  1. Choppy Market Risk: May generate frequent false breakout signals in range-bound markets.
  2. Slippage Risk: In less liquid markets, breakout signals may result in entry prices deviating due to slippage.
  3. Over-Filtering Risk: Enabling volume filter might miss some valid trading opportunities.
  4. Parameter Sensitivity: Strategy performance is sensitive to parameter settings, requiring careful optimization.

Strategy Optimization Directions

  1. Add Trend Strength Filter: Can incorporate trend strength indicators like ADX to enter only during strong trends.
  2. Optimize Volume Indicator: Consider using relative volume or volume breakout indicators instead of simple moving averages.
  3. Add Time Filter: Implement trading time window settings to avoid highly volatile market periods.
  4. Dynamic Parameter Optimization: Automatically adjust channel period and SuperTrend parameters based on market volatility.
  5. Introduce Machine Learning: Use machine learning algorithms to optimize parameter selection and signal filtering.

Summary

This strategy builds a relatively comprehensive trend-following trading system by integrating multiple technical indicators. Its strengths lie in high signal reliability and flexible risk management, though traders still need to optimize parameters according to specific market characteristics. Through continuous improvement and optimization, this strategy has the potential to achieve stable trading results in trending markets.

Strategy source code
/*backtest
start: 2024-10-01 00:00:00
end: 2025-02-19 08:00:00
period: 1d
basePeriod: 1d
exchanges: [{"eid":"Binance","currency":"ETH_USDT"}]
*/

// Breakout trading system based on Donchain channel strategy that works best on a weekly chart and daily charts. Weekly is preferred. 

//@version=5

strategy('Donchian BO with Volume Filter and Supertrend', shorttitle='DBO+Vol+ST', default_qty_type=strategy.percent_of_equity, default_qty_value=2, overlay=true)

// Input options to configure backtest date range
startDate = input.int(title='Start Date', defval=1, minval=1, maxval=31)
startMonth = input.int(title='Start Month', defval=1, minval=1, maxval=12)
startYear = input.int(title='Start Year', defval=2016, minval=1800, maxval=2100)
avgVol = input.int(title="Avg Volume length", defval=20)
srcInput = input.source(close, "Source")

// Volume filter toggle
useVolumeFilter = input.bool(true, title='Enable Volume Filter')

endDate = input.int(title='End Date', defval=1, minval=1, maxval=31)
endMonth = input.int(title='End Month', defval=7, minval=1, maxval=12)
endYear = input.int(title='End Year', defval=2030, minval=1800, maxval=2100)

multiplier = input.int(title='SuperTrend Mult', defval=2, minval=1, maxval=12)
stlen = input.int(title='SuperTrend Length', defval=10, minval=1, maxval=12)

length = input.int(21, minval=1)
exit = input.int(3, minval=1, maxval=4, title='Exit Option')  // Use Option 1 to exit using lower band; Use Option 2 to exit using basis line

lower = ta.lowest(length)
upper = ta.highest(length)
basis = math.avg(upper, lower)

// Plotting the Donchian channel
l = plot(lower, color=color.new(color.blue, 0))
u = plot(upper, color=color.new(color.blue, 0))
plot(basis, color=color.new(color.orange, 0))
fill(u, l, color=color.new(color.blue, 90))

// Check if the current bar is in the date range
inDateRange = time >= timestamp(syminfo.timezone, startYear, startMonth, startDate, 0, 0) and time < timestamp(syminfo.timezone, endYear, endMonth, endDate, 0, 0)

// Long trailing stop-loss percentage
longTrailPerc = input.float(title='Trail Long Loss (%)', minval=0.0, step=0.1, defval=3) * 0.01
longStopPrice = 0.0

longStopPrice := if strategy.position_size > 0
    stopValue = close * (1 - longTrailPerc)
    math.max(stopValue, longStopPrice[1])
else
    0

// Volume filter: 20-period moving average
volumeMA = ta.sma(volume, avgVol)

// Long entry condition: Donchian breakout + volume filter
longCondition = ta.crossover(srcInput, upper[1]) and (not useVolumeFilter or volume > volumeMA)
longsma = ta.sma(close, 200)

if inDateRange and longCondition
    strategy.entry('Long', strategy.long)

// Exit conditions
if inDateRange and exit == 1
    if ta.crossunder(close, lower[1])
        strategy.close('Long')

if inDateRange and exit == 2
    if ta.crossunder(close, basis[1])
        strategy.close('Long')

[superTrend, dir] = ta.supertrend(multiplier, stlen)
if inDateRange and exit == 3
    if ta.crossunder(close, superTrend)
        strategy.close('Long')

if inDateRange and exit == 4
    if strategy.position_size > 0
        strategy.exit(id='XL TRL STP', stop=longStopPrice)

// Short conditions (commented out for now)
shortCondition = ta.crossunder(close, lower[1])

// Exit all positions when date range ends
if not inDateRange
    strategy.close_all()

// --- Add Supertrend Indicator ---
stColor = dir == 1 ? color.red : color.green
plot(superTrend, color=stColor, title="SuperTrend", linewidth=2)