
Overview
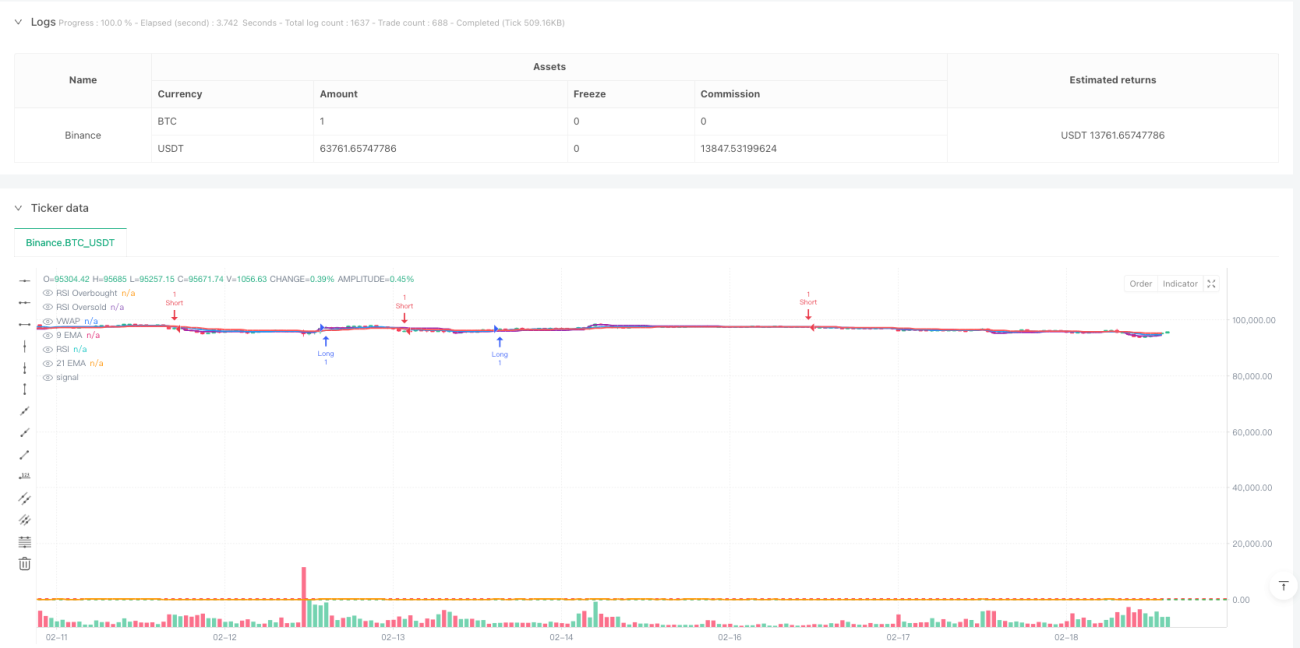
This strategy is a comprehensive trading system that combines multiple technical indicators to confirm trading signals. The core logic is based on the crossover of fast and slow Exponential Moving Averages (EMA), with signal confirmation through Volume-Weighted Average Price (VWAP) and Relative Strength Index (RSI). The system employs a dynamic stop-loss approach based on Average True Range (ATR) to ensure scientific and flexible risk management.
Strategy Principles
The core principles of the strategy involve the coordination of multiple technical indicators to confirm trading direction. Specifically:
- Using 9-period and 21-period EMA crossovers to capture price momentum changes
- Utilizing VWAP to determine price position relative to daily average transaction price
- Employing RSI to judge market overbought/oversold conditions
- Setting dynamic stop-loss positions based on ATR, using 1.5x ATR as the stop-loss distance
- Implementing a 2:1 risk-reward ratio for take-profit positions
Strategy Advantages
- Comprehensive indicator system reduces false signals through multiple confirmations
- Dynamic stop-loss approach adapts to market volatility
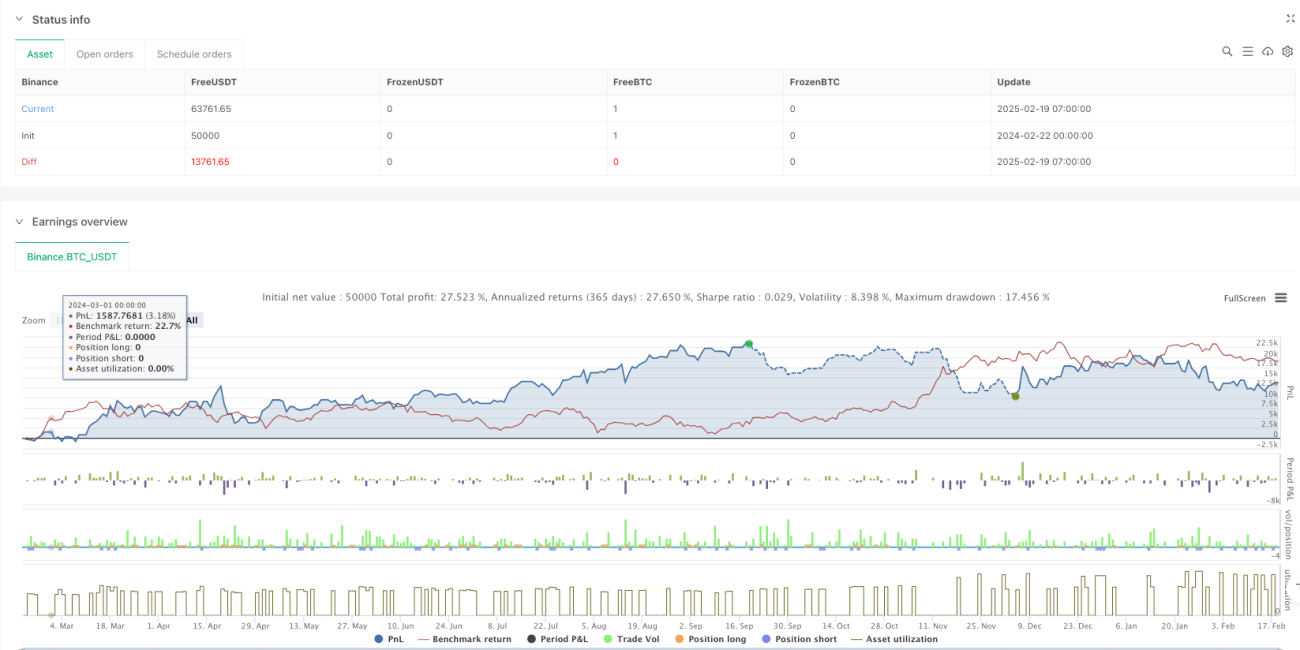
- Fixed risk-reward ratio promotes long-term stable trading
- Integration with institutional traders' VWAP indicator better captures large capital movements
- High level of system automation reduces emotional interference
Strategy Risks
- May generate frequent false signals in ranging markets
- Multiple indicator confirmation might miss some trading opportunities
- Fixed risk-reward ratio may lack flexibility in certain market conditions
- Technical indicators may fail during significant news events
- Trading costs need to be considered for strategy profitability
Strategy Optimization Directions
- Introduce volatility indicators to adjust parameters in different market conditions
- Add volume analysis to improve signal reliability
- Develop adaptive risk-reward ratio system
- Incorporate market structure analysis to optimize trade timing
- Consider adding fundamental filters to enhance risk resistance
Summary
This strategy constructs a relatively complete trading system through the organic combination of multiple technical indicators. It emphasizes both signal accuracy and risk management importance. While certain limitations exist, through continuous optimization and improvement, the strategy shows promise for maintaining stable performance across various market conditions. The key is to continuously adjust parameters based on actual trading results and flexibly apply the strategy according to changing market environments.
- 1