Adaptive Bollinger Bands Grid Trading Strategy with Dynamic Level Adjustment

BB SMA GRID stdev
Created on: 2025-02-21 11:52:10 Modified on: 2025-02-27 17:04:20
Copy: 3 Number of hits: 691
avatar of ianzeng123 ianzeng123
2
Follow
319
Followers

 Adaptive Bollinger Bands Grid Trading Strategy with Dynamic Level Adjustment  Adaptive Bollinger Bands Grid Trading Strategy with Dynamic Level Adjustment

Overview

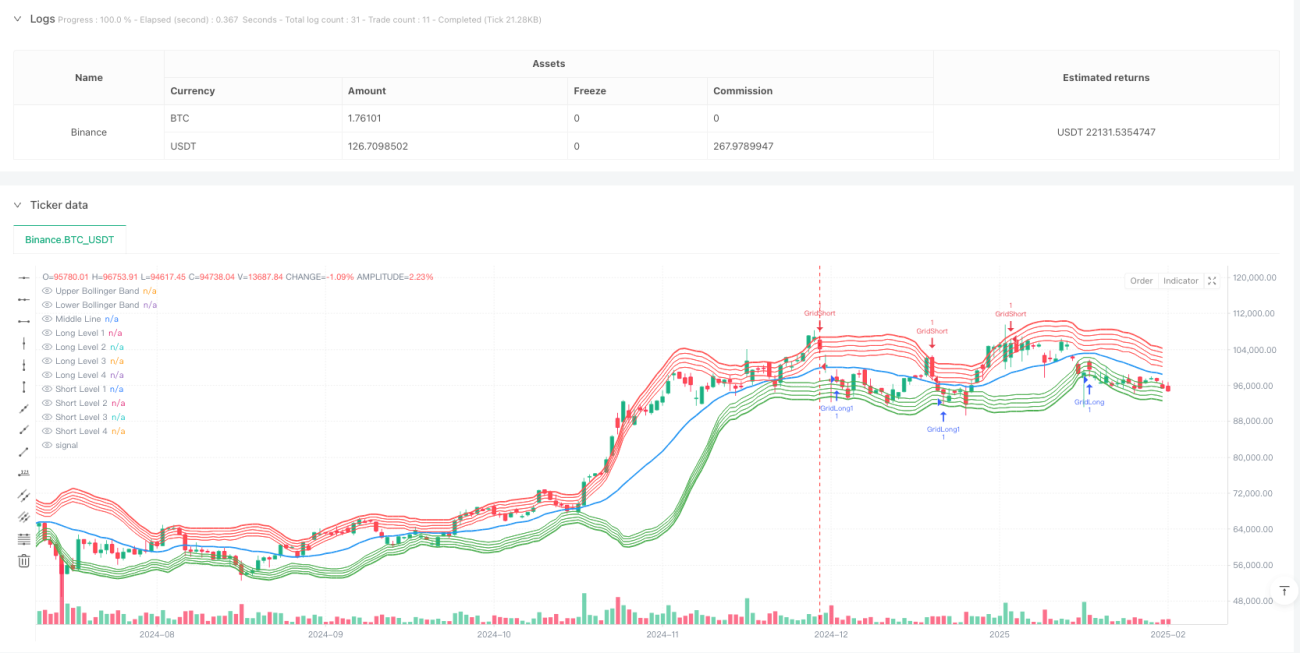
This is an advanced grid trading strategy based on Bollinger Bands indicators. The strategy dynamically determines grid positions using Bollinger Bands’ upper, lower, and middle bands, automatically adjusting grid spacing according to market volatility. The system executes corresponding long and short trades when prices break through grid lines, achieving fully automated grid trading.

Strategy Principle

The strategy uses a 20-period moving average as the middle band of Bollinger Bands, with 2 standard deviations as the bandwidth. Based on Bollinger Bands, the strategy sets up 4 grid levels between the upper and lower bands, with 1% grid spacing. When the price breaks through a grid line upward, the system executes a long position; when the price breaks through downward, the system executes a short position. This design enables the strategy to continuously profit in oscillating markets.

Strategy Advantages

  1. Dynamic Adjustment - Grid positions move with Bollinger Bands, allowing the strategy to adapt to different market environments
  2. Controlled Risk - Trading range is limited by Bollinger Bands, avoiding excessive positions in extreme market conditions
  3. High Automation - System executes trades automatically without manual intervention
  4. Bidirectional Trading - Can profit in both up and down markets
  5. Adjustable Parameters - Grid spacing and level numbers can be flexibly adjusted as needed

Strategy Risks

  1. Trend Market Risk - May generate significant drawdowns in unidirectional trend markets
  2. Fund Management Risk - Multiple triggered grids may lead to excessive positions
  3. Slippage Risk - Violent market fluctuations may cause execution prices to deviate from grid levels
  4. Technical Risk - Bollinger Bands may generate false breakout signals

Solutions: - Set total position limits - Introduce trend filters - Optimize order execution mechanism - Add confirmation signal filtering

Strategy Optimization Directions

  1. Adaptive Grid Spacing - Dynamically adjust grid spacing based on volatility
  2. Incorporate Volume-Price Relationship - Optimize entry timing using volume indicators
  3. Optimize Stop Loss Mechanism - Design more flexible stop loss solutions
  4. Fund Management Optimization - Implement risk-based position management
  5. Multi-timeframe Coordination - Introduce multi-period signal confirmation mechanism

Summary

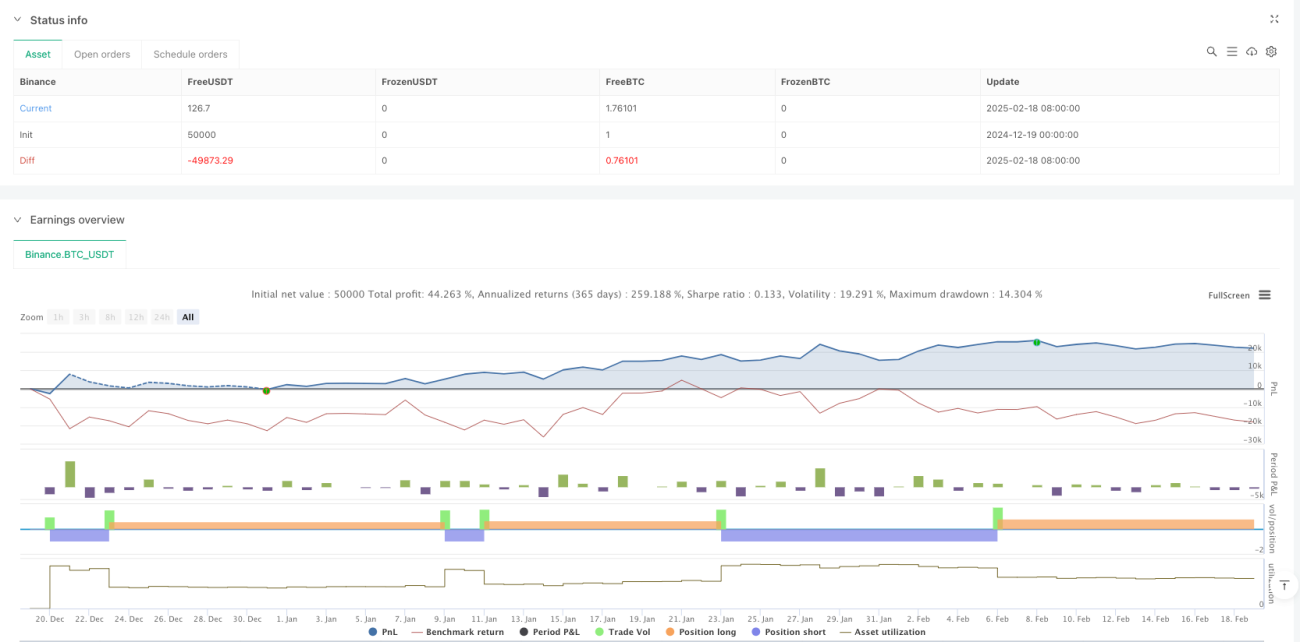
Through the combination of Bollinger Bands and grid trading, this strategy achieves an automated trading system that balances flexibility and stability. The core advantage of the strategy lies in its ability to adapt to different market environments while achieving risk control through parameter adjustment. Although there are some inherent risks, a more robust trading system can be built through continuous optimization and improvement.

Strategy source code
/*backtest
start: 2024-12-19 00:00:00
end: 2025-02-19 08:00:00
period: 1d
basePeriod: 1d
exchanges: [{"eid":"Binance","currency":"BTC_USDT"}]
*/

//@version=6
strategy("Grid Bot based on Bollinger Bands with Adjustable Levels", overlay=true)

// Settings
source = close
length = input.int(20, minval=1, title="Bollinger Bands Length")
mult = input.float(2.0, minval=0.001, maxval=50, title="Bollinger Bands Multiplier")
gridDistancePercent = input.float(1.0, title="Distance Between Levels (%)") / 100 // Distance between grid levels in percentage
gridSize = input.int(4, title="Number of Grid Levels") // Number of grid levels

// Bollinger Bands Calculation
basis = ta.sma(source, length)
dev = mult * ta.stdev(source, length)
upper = basis + dev
lower = basis - dev

// Middle line between the upper and lower Bollinger Bands
middle = (upper + lower) / 2

// Levels for long and short positions
var float[] longLevels = array.new_float(gridSize)
var float[] shortLevels = array.new_float(gridSize)

// Filling levels for long and short positions
for i = 0 to gridSize - 1
    array.set(longLevels, i, lower * (1 + gridDistancePercent * (i + 1))) // For longs, increase the lower band
    array.set(shortLevels, i, upper * (1 - gridDistancePercent * (i + 1))) // For shorts, decrease the upper band

// Logic for entering a long position (buy) at the first level crossover
longCondition = ta.crossover(source, array.get(longLevels, 0)) // Condition for buying — crossover with the first long level
if longCondition
    strategy.entry("GridLong", strategy.long, comment="GridLong")

// Logic for entering a short position (sell) at the first level crossunder
shortCondition = ta.crossunder(source, array.get(shortLevels, 0)) // Condition for selling — crossunder with the first short level
if shortCondition
    strategy.entry("GridShort", strategy.short, comment="GridShort")

// Logic for additional buys/sells when reaching subsequent levels
// For longs:
for i = 1 to gridSize - 1
    if ta.crossover(source, array.get(longLevels, i))
        strategy.entry("GridLong" + str.tostring(i), strategy.long, comment="GridLong")

// For shorts:
for i = 1 to gridSize - 1
    if ta.crossunder(source, array.get(shortLevels, i))
        strategy.entry("GridShort" + str.tostring(i), strategy.short, comment="GridShort")

// Visualization of the levels
plot(upper, color=color.red, linewidth=2, title="Upper Bollinger Band")
plot(lower, color=color.green, linewidth=2, title="Lower Bollinger Band")
plot(middle, color=color.blue, linewidth=2, title="Middle Line")

// Display additional grid levels (fixed titles)
plot(array.get(longLevels, 0), color=color.green, linewidth=1, title="Long Level 1") // For the 1st long level
plot(array.get(longLevels, 1), color=color.green, linewidth=1, title="Long Level 2") // For the 2nd long level
plot(array.get(longLevels, 2), color=color.green, linewidth=1, title="Long Level 3") // For the 3rd long level
plot(array.get(longLevels, 3), color=color.green, linewidth=1, title="Long Level 4") // For the 4th long level

plot(array.get(shortLevels, 0), color=color.red, linewidth=1, title="Short Level 1") // For the 1st short level
plot(array.get(shortLevels, 1), color=color.red, linewidth=1, title="Short Level 2") // For the 2nd short level
plot(array.get(shortLevels, 2), color=color.red, linewidth=1, title="Short Level 3") // For the 3rd short level
plot(array.get(shortLevels, 3), color=color.red, linewidth=1, title="Short Level 4") // For the 4th short level