
Strategy Overview
This strategy is a composite trading system combining dual moving average crossover, RSI overbought/oversold, and ATR volatility filtering. The system generates trading signals using short-term and long-term moving averages, filters market conditions through RSI indicators, assesses volatility using ATR, and implements position management and risk control through percentage-based stop-loss and risk-reward ratios. The strategy demonstrates strong adaptability and can flexibly adjust parameters based on market conditions.
Strategy Principles
The core logic of the strategy is based on the following aspects:
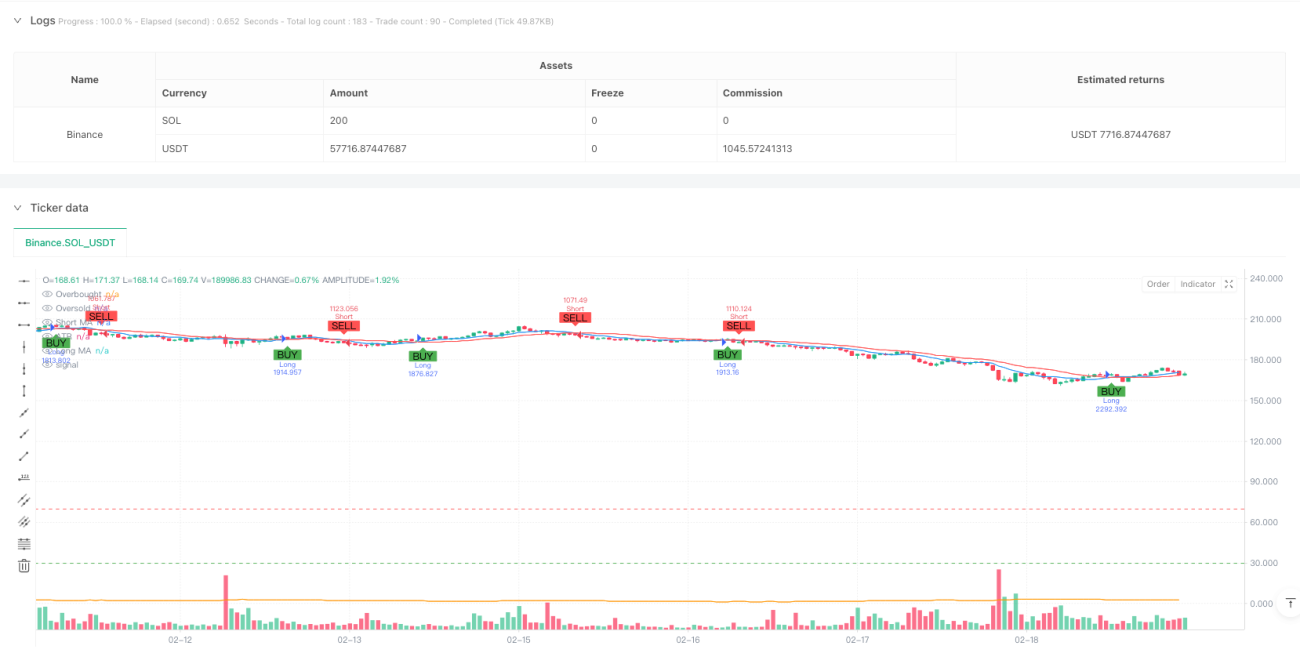
- Signal Generation: Captures trend changes using crossovers of 9-day and 21-day simple moving averages. Long signals are generated when the short-term MA crosses above the long-term MA, and short signals when it crosses below.
- Condition Filtering: Filters overbought/oversold conditions using RSI indicator to avoid entering trades in extreme market conditions. Uses ATR indicator to ensure market volatility meets trading criteria.
- Risk Management: Employs percentage-based stop-loss relative to account equity, determines take-profit levels through risk-reward ratios to achieve reasonable returns while hedging risks.
Strategy Advantages
- Strong System Adaptability: Strategy can flexibly adjust to different market environments through enabling/disabling RSI and ATR filters.
- Comprehensive Risk Control: Effectively controls risk exposure per trade through percentage-based stop-loss and dynamic position management.
- High Signal Reliability: Reduces impact of false signals through multiple filtering mechanisms, improving trade success rate.
- Strong Parameter Adjustability: All parameters can be optimized and adjusted according to specific market characteristics.
Strategy Risks
- Ranging Market Risk: Moving average crossovers may generate frequent false signals in sideways markets.
- Lag Risk: Moving averages have inherent lag, potentially missing optimal entry points.
- Parameter Optimization Risk: Over-optimization may lead to strategy overfitting, affecting live trading performance.
- Market Environment Dependency: Strategy performs better in trending markets but may underperform in other market conditions.
Strategy Optimization Directions
- Dynamic Parameter Adjustment: Automatically adjust MA periods and RSI thresholds based on market volatility.
- Add Trend Strength Filtering: Introduce DMI or ADX indicators to evaluate trend strength.
- Optimize Stop-Loss Methods: Consider implementing trailing stops or ATR-based dynamic stop-losses.
- Improve Position Management: Introduce volatility-based dynamic position sizing system.
Summary
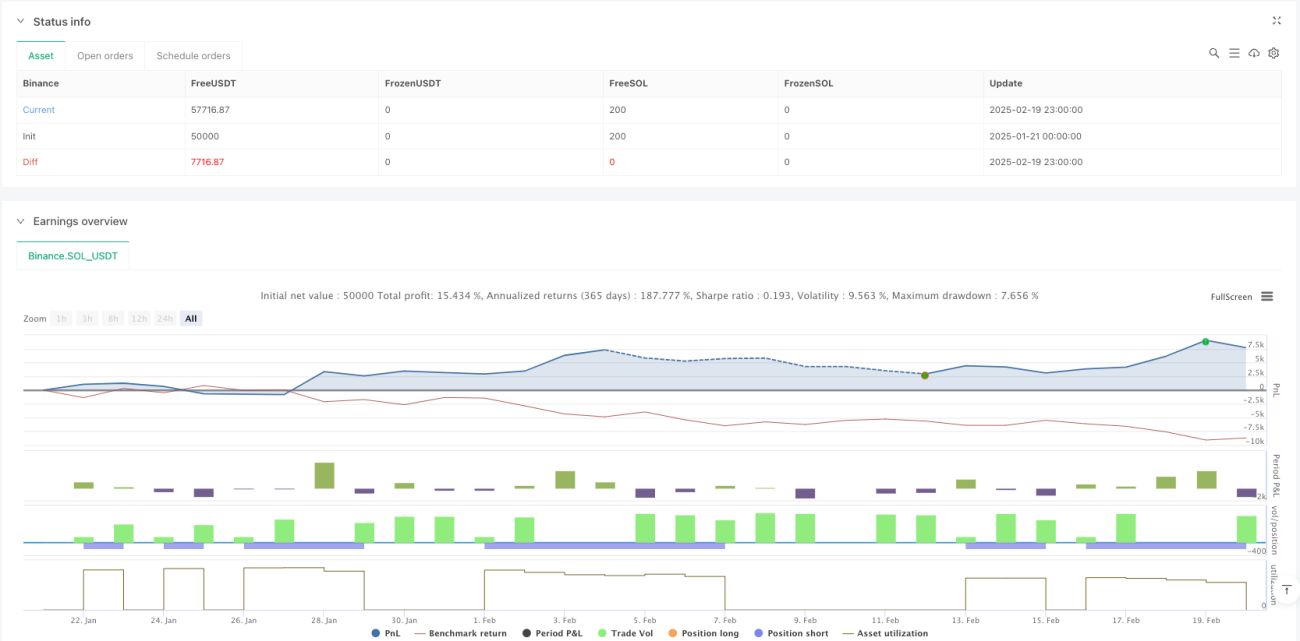
The strategy constructs a relatively complete trading system by combining multiple technical indicators. It performs excellently in trending markets and demonstrates good risk control capabilities. Through proper parameter settings and necessary filtering conditions, the strategy can adapt to different market environments. Thorough backtesting and parameter optimization are recommended before live implementation.
/*backtest
start: 2025-01-21 00:00:00
end: 2025-02-20 00:00:00
period: 1h
basePeriod: 1h
exchanges: [{"eid":"Binance","currency":"SOL_USDT"}]
*/

//@version=5
strategy("Simplified MA Crossover Strategy with Disable Options", overlay=true, default_qty_type=strategy.percent_of_equity, default_qty_value=10)

// Inputs- 1