Multi-Period Bollinger Bands Crossover Trend Following Strategy

Overview
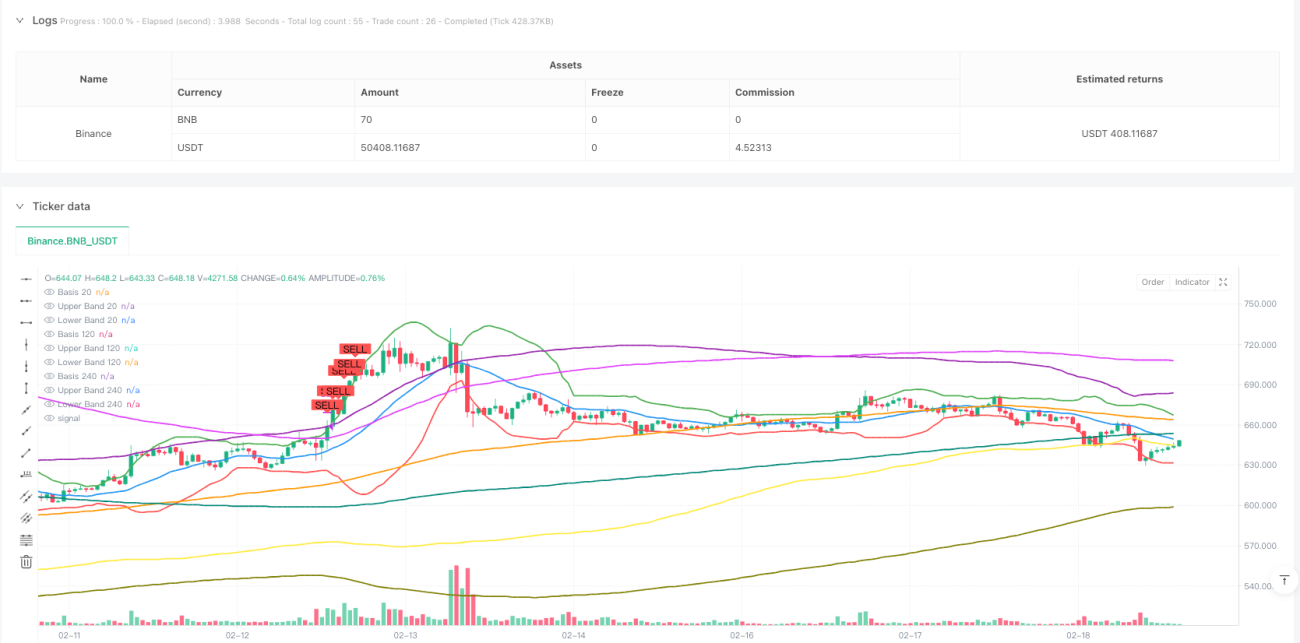
This is a trend-following strategy based on triple Bollinger Bands. The strategy identifies market overbought and oversold conditions by combining Bollinger Bands of different periods (20, 120, and 240) and generates trading signals when prices break through all three bands. This combination of multi-period Bollinger Bands effectively filters false signals and improves trading accuracy.
Strategy Principle
The strategy utilizes three Bollinger Bands with different periods (20, 120, and 240), each consisting of a middle band (SMA) and upper/lower bands (2 standard deviations). When the price breaks below all three lower bands simultaneously, it indicates potential oversold conditions, triggering a long signal. When the price breaks above all three upper bands, it indicates potential overbought conditions, triggering a position close signal. By observing Bollinger Bands across multiple timeframes, the strategy better confirms trend strength and persistence.
Strategy Advantages
- Multiple confirmation mechanism: Using three different period Bollinger Bands as filters effectively reduces false signals.
- Trend following capability: Through the dynamic adjustment characteristics of Bollinger Bands, the strategy can adapt to different market environments.
- Clear risk control: Bollinger Bands have statistical significance, providing clear reference points for entry and exit.
- Parameter adjustability: The strategy offers parameter settings for Bollinger Band periods and multipliers, allowing optimization for different market characteristics.
Strategy Risks
- Sideways market risk: May generate frequent false signals in oscillating markets, leading to overtrading.
- Lag risk: Due to the use of longer-period moving averages, may miss optimal entry points at trend turning points.
- Money management risk: Without proper stop-loss placement, may suffer significant losses during violent fluctuations.
- Parameter dependency: Optimal parameters may vary significantly across different market environments, requiring periodic optimization.
Strategy Optimization Directions
- Introduce volume-price relationship indicators: Add trading volume as an auxiliary indicator to improve signal reliability.
- Optimize stop-loss mechanism: Recommend adding trailing stops or ATR-based stops for better risk control.
- Add trend confirmation indicators: Consider combining with other trend indicators (like MACD, DMI) for cross-validation.
- Dynamic parameter adjustment: Automatically adjust Bollinger Band parameters based on market volatility to improve strategy adaptability.
- Improve signal filtering: Add trading time filters, volatility filters, and other conditions to reduce false signals.
Summary
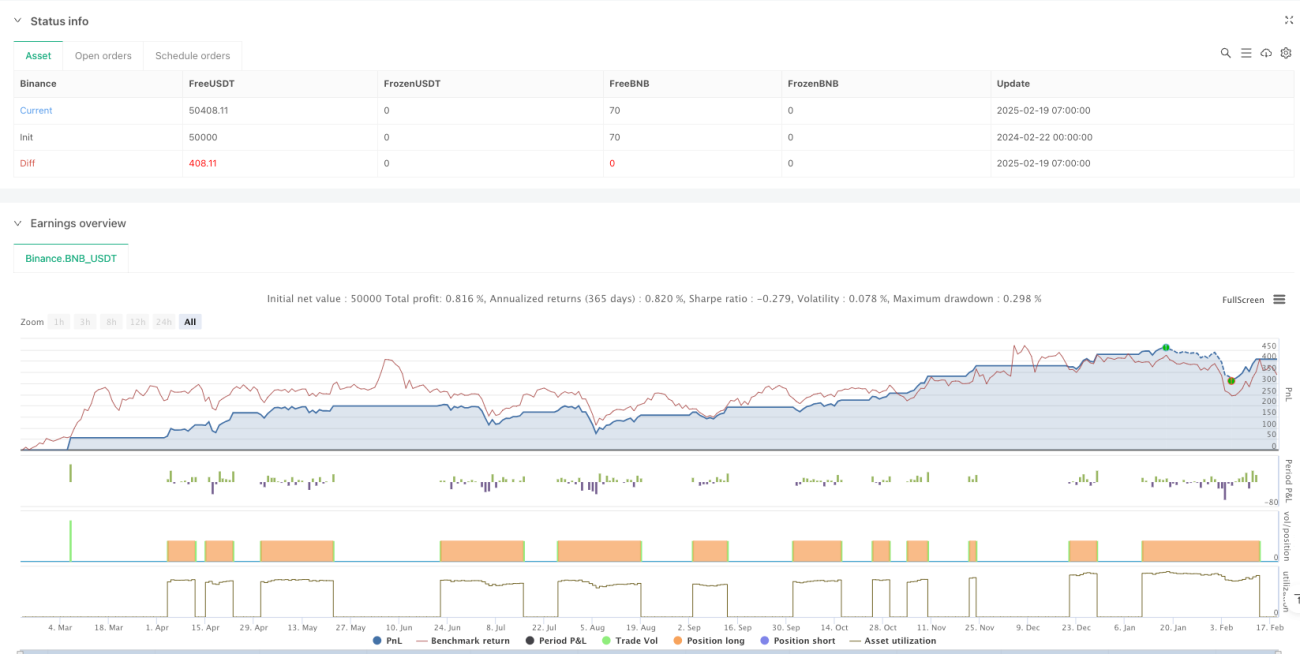
This is a trend-following strategy based on multi-period Bollinger Bands, confirming trading signals through triple Bollinger Band crossovers, with strong reliability and adaptability. The strategy's core advantages lie in its multiple confirmation mechanism and clear risk control system, but attention must be paid to its performance in oscillating markets and parameter optimization issues. Through incorporating volume-price analysis, improving stop-loss mechanisms, and dynamic parameter adjustments, the strategy's stability and profitability can be further enhanced.
- 1