Dynamic Breakout Falling Wedge Trendline Quantitative Trading Strategy

Overview
This strategy is a trend breakout trading system based on the falling wedge pattern in technical analysis. It dynamically identifies highs and lows in price action to construct upper and lower trendlines, entering long positions when price breaks above the upper trendline. The strategy employs dynamic take-profit and stop-loss mechanisms to control risk and lock in profits. This is a programmatic implementation of a classic technical analysis trading method, particularly suitable for capturing reversal opportunities when downtrends are potentially ending.
Strategy Principles
The core logic includes several key steps:
- Using Pivot method to dynamically identify highs and lows in price movement
- Recording and storing the last two highs and lows with their corresponding time indices
- Calculating slopes of upper and lower trendlines based on these points
- Identifying falling wedge formation: requiring descending highs and lows, with upper trendline slope less than lower trendline slope
- Triggering buy signals when price breaks above the upper trendline
- Setting percentage-based take-profit and stop-loss conditions relative to entry price
Strategy Advantages
- Dynamic Market Structure Recognition: Automatically identifies key price points without manual intervention
- Trend Reversal Capture: Focuses on capturing potential reversals of downtrends, typically high-reward opportunities
- Precise Signal Generation: Accurately calculates trendline positions and breakout points using mathematical methods
- Comprehensive Risk Management: Includes preset take-profit and stop-loss mechanisms for effective risk control
- Systematic Operation: Fully systematized strategy logic, avoiding emotional interference
Strategy Risks
- False Breakout Risk: Market may produce false breakouts leading to incorrect signals
- Parameter Sensitivity: Strategy effectiveness is sensitive to parameter settings, requiring adjustment in different market conditions
- Market Condition Dependency: May generate excessive false signals in ranging markets
- Stop Loss Risk: Fast market movements may cause slippage in actual stop loss execution
- Transaction Cost Impact: Frequent trading may incur high transaction costs
Strategy Optimization Directions
- Signal Confirmation Mechanism: Add volume, momentum indicators for breakout confirmation
- Dynamic Parameter Optimization: Introduce adaptive mechanisms to adjust parameters based on market volatility
- Multiple Timeframe Verification: Add multi-timeframe confirmation to improve signal reliability
- Improved Stop Loss/Take Profit: Implement dynamic mechanisms like trailing stops
- Market Environment Filtering: Add trend filters to trade only in suitable market conditions
Summary
This is a well-designed trend trading strategy that implements traditional technical analysis methods programmatically. Its strength lies in automated market structure identification and potential trend reversal capture. However, attention must be paid to false breakouts and parameter optimization. With further enhancement and refinement, this strategy has potential for improved performance in actual trading.
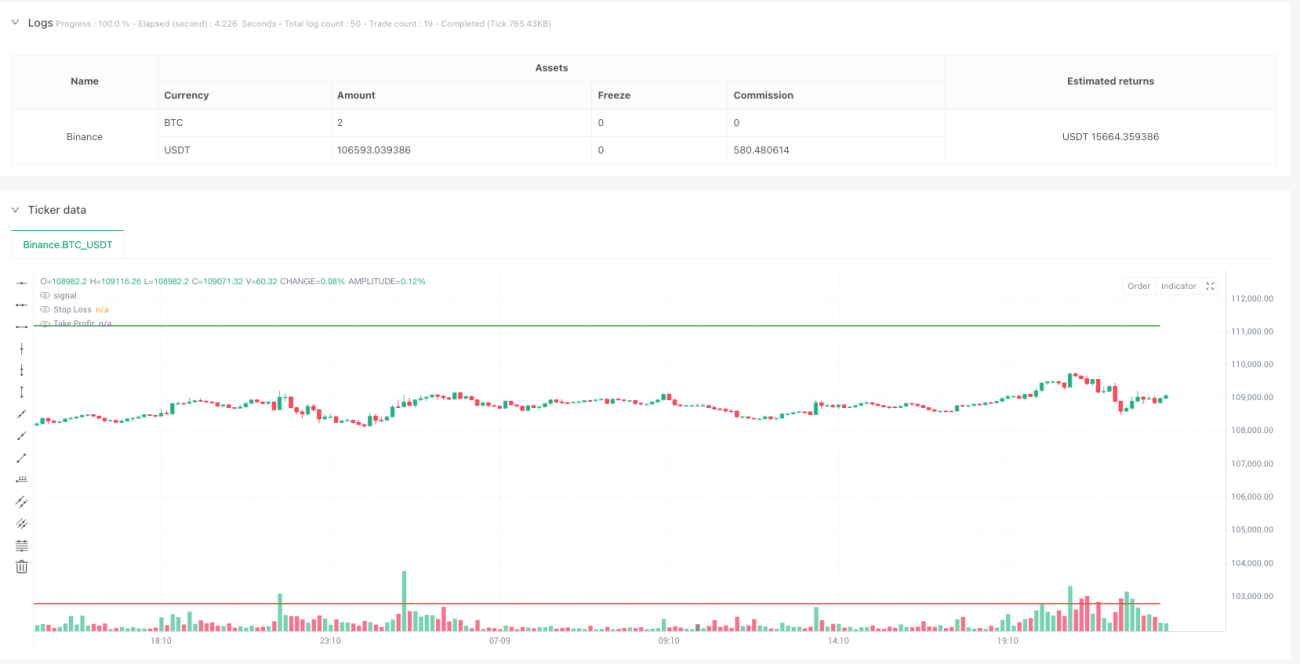
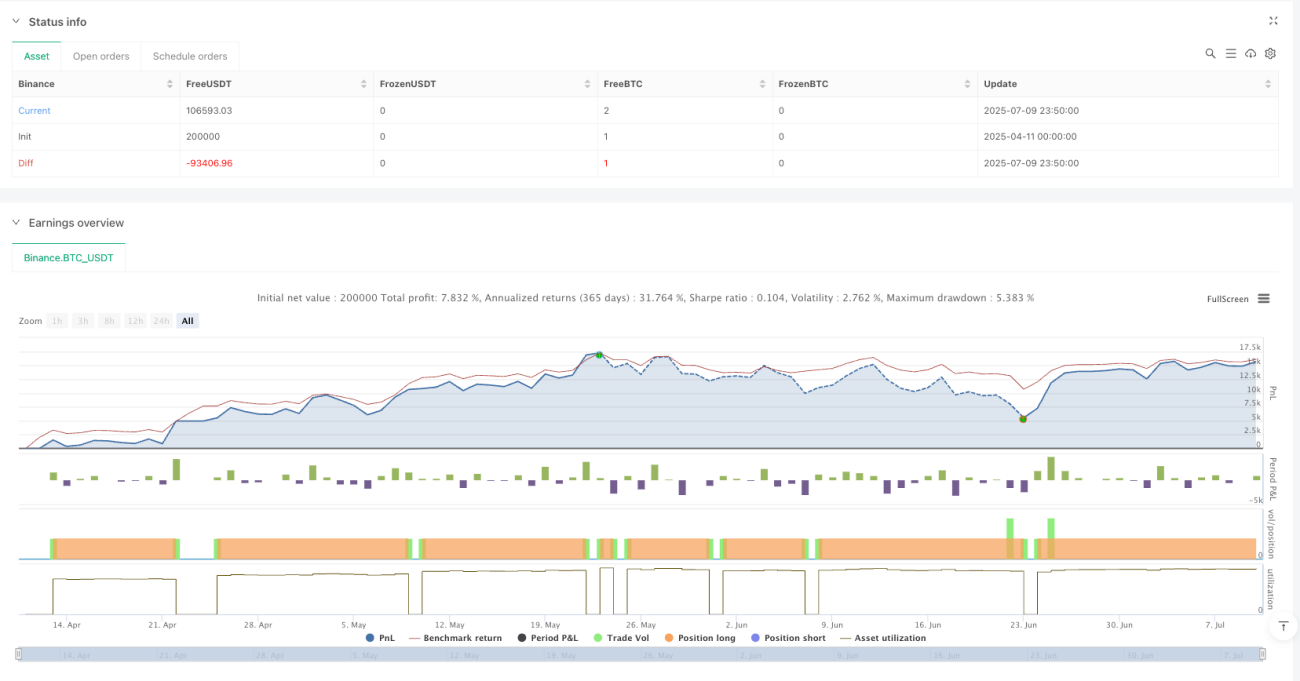
/*backtest
start: 2025-04-11 00:00:00
end: 2025-07-10 00:00:00
period: 10m
basePeriod: 10m
exchanges: [{"eid":"Binance","currency":"BTC_USDT","balance":200000}]
*/

// This Pine Script™ code is subject to the terms of the Mozilla Public License 2.0 at https://mozilla.org/MPL/2.0/

//@version=6
strategy("Falling Wedge Strategy by Nitin", overlay=true)- 1