
Overview
This strategy is an intraday trading system that combines previous day's price range breakout with exponential moving averages (EMAs). It identifies trading opportunities when price breaks through the previous day's high or low, confirmed by fast and slow EMAs. The strategy focuses on capturing short-term price momentum while managing risk through fixed stop-loss points and risk-reward ratio.
Strategy Principles
The core logic of the strategy is based on the following key elements:
- Using request.security function to obtain the previous day's high and low as key price levels.
- Calculating 9-period and 21-period exponential moving averages (EMAs) as trend confirmation indicators.
- Triggering long signals when price breaks above previous day's high and fast EMA is above slow EMA.
- Triggering short signals when price breaks below previous day's low and fast EMA is below slow EMA.
- Managing risk through fixed stop-loss points (30 points) and risk-reward ratio (2.0) for each trade.
- Optional time filter functionality supporting trading during specific sessions (SAST timezone).
Strategy Advantages
- Clear structure and simple logic: Strategy employs easy-to-understand and execute breakout logic.
- Comprehensive risk management: Implements strict risk control through fixed stop-loss points and risk-reward ratio.
- Flexible time management: Optional time filter allows trading during most active market sessions.
- Multiple confirmation mechanism: Combines price breakout and EMAs trend confirmation to reduce false signals.
- High automation level: Strategy can be fully automated, reducing human intervention.
Strategy Risks
- False breakout risk: Price may quickly retrace after breakout, triggering stop-loss.
- Slippage risk: Actual execution prices may significantly deviate from signal prices during high volatility.
- Fixed stop-loss risk: Fixed point stop-loss may not adapt to all market conditions.
- Market volatility risk: May generate excessive trading signals during low volatility periods.
Strategy Optimization Directions
- Dynamic stop-loss optimization: Consider adjusting stop-loss points based on market volatility.
- Trading time optimization: Optimize trading window settings through historical data analysis.
- Signal filter enhancement: Add volume or volatility indicators as additional filtering conditions.
- EMAs parameter optimization: Determine optimal EMAs periods through backtesting.
- Position management optimization: Introduce volatility-based dynamic position sizing mechanism.
Summary
The strategy implements a reliable intraday trading system by combining price breakout and EMAs trend confirmation. Its core strengths lie in clear logical structure and comprehensive risk management mechanism. Through suggested optimization directions, the strategy can further enhance its stability and profitability. In live trading, special attention should be paid to false breakout and slippage risks, with parameters adjusted according to actual market conditions.
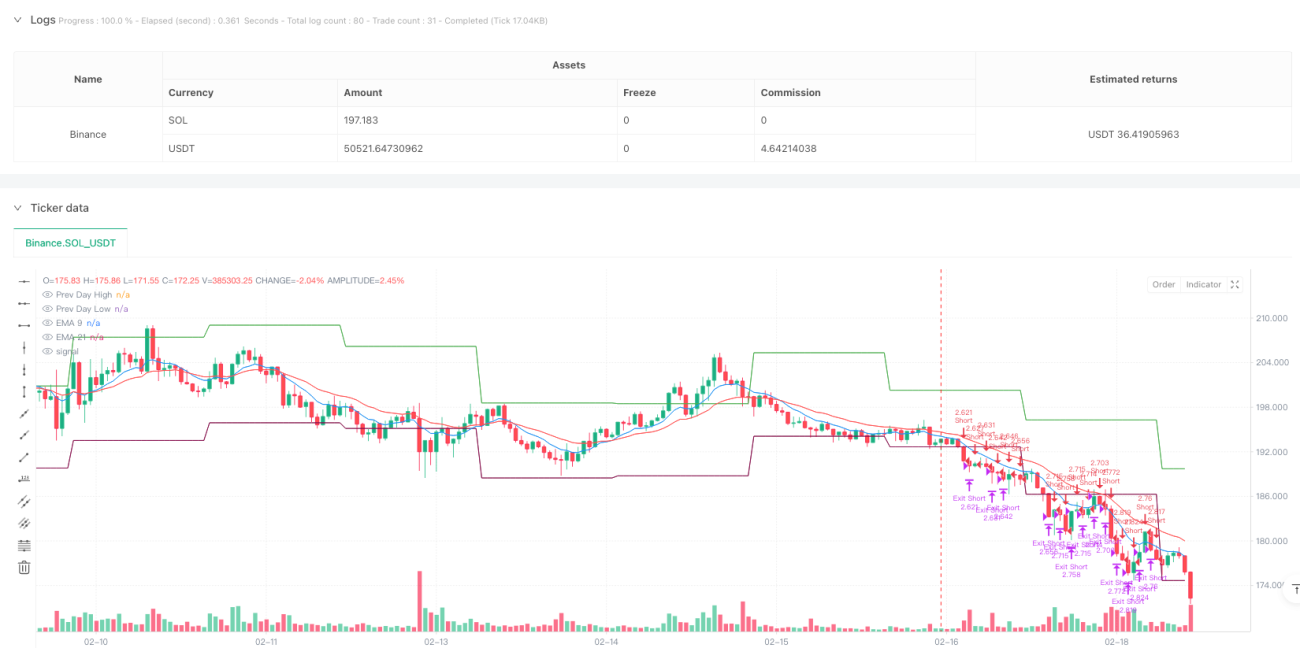
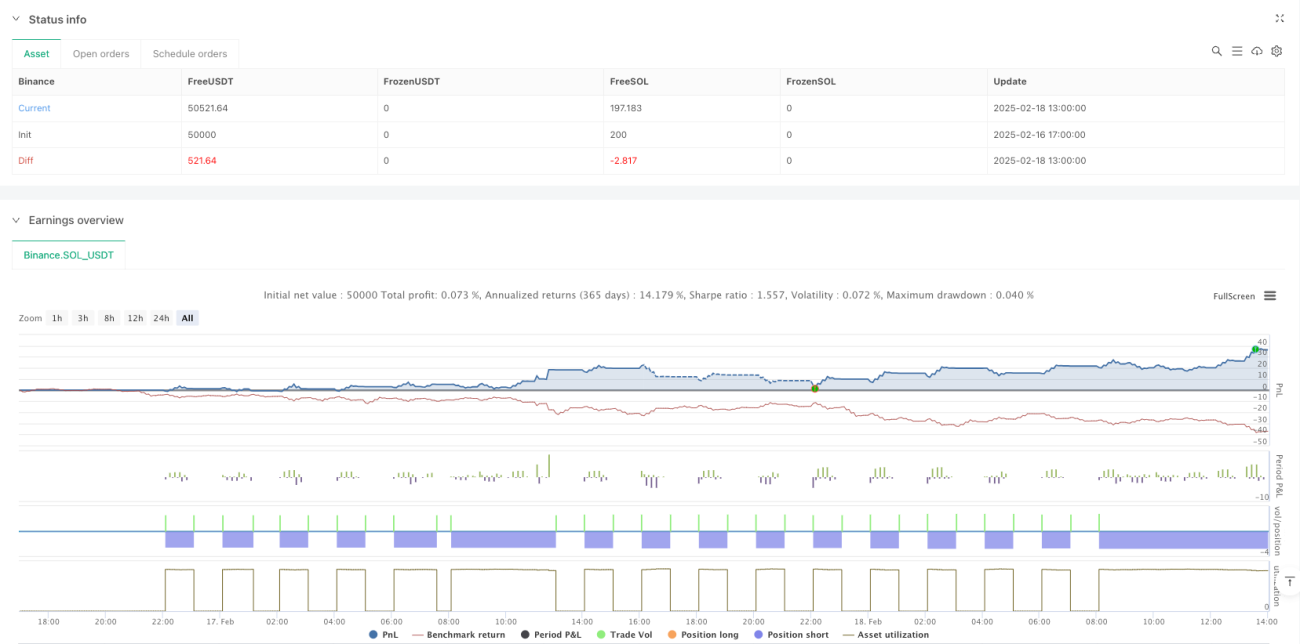
/*backtest
start: 2025-02-16 17:00:00
end: 2025-02-18 14:00:00
period: 1h
basePeriod: 1h
exchanges: [{"eid":"Binance","currency":"SOL_USDT"}]
*/

//@version=5
strategy("GER40 Momentum Breakout Scalping", overlay=true, initial_capital=10000, default_qty_type=strategy.percent_of_equity, default_qty_value=1)

//———— Input Parameters —————- 1