Overview
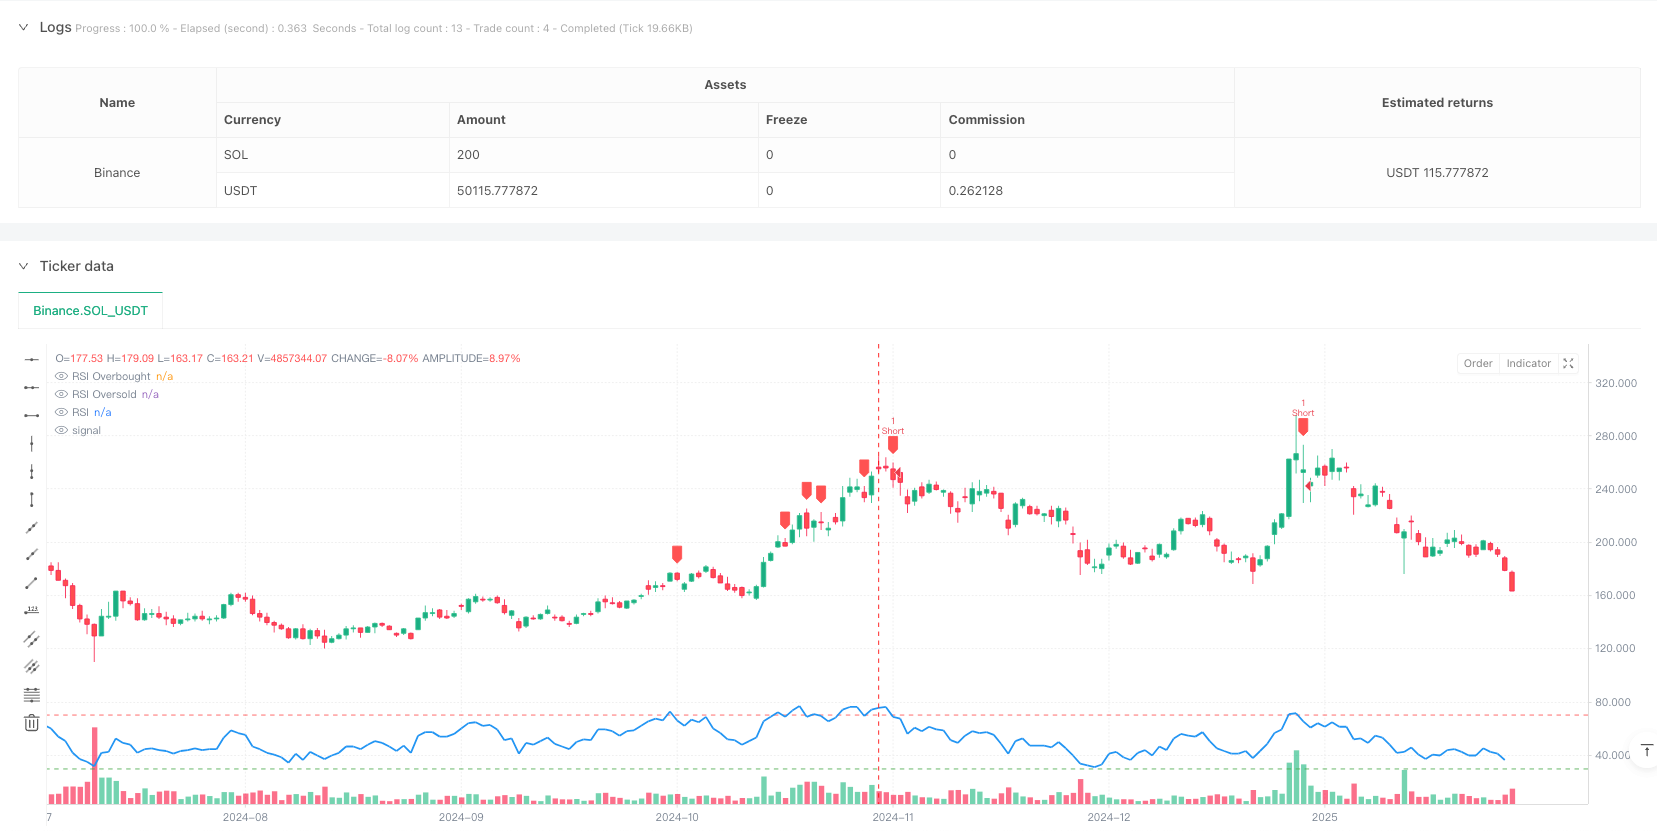
This strategy combines RSI overbought/oversold signals with Bollinger Bands boundaries to create a trading system that manages risk through dynamic stop-loss levels and reward-to-risk ratio-based take-profit levels. The core mechanism triggers trading signals when RSI crosses overbought/oversold levels, enhanced by price position within Bollinger Bands.
Strategy Principles
The strategy operates on several key principles: 1. Uses 14-period RSI to measure market overbought/oversold conditions 2. Generates long signals when RSI crosses above 30 (oversold) 3. Generates short signals when RSI crosses below 70 (overbought) 4. Sets long stop-loss based on 10-period low 5. Sets short stop-loss based on 10-period high 6. Calculates take-profit levels using 2:1 reward-to-risk ratio 7. Confirms trade signals using Bollinger Bands position
Strategy Advantages
- Dynamic Risk Management: Strategy adapts to market volatility through dynamic stop-loss and take-profit levels
- Clear Risk-Reward Ratio: Fixed 2:1 ratio promotes consistent long-term profitability
- Multiple Signal Confirmation: Combines RSI and Bollinger Bands for improved signal reliability
- Automated Execution: Eliminates emotional bias through complete automation
- Flexible Parameters: Adjustable RSI and risk management parameters for different market characteristics
Strategy Risks
- False Breakout Risk: RSI crossover signals may generate false breakouts
- Ranging Market Risk: Frequent stop-losses may occur in sideways markets
- Stop-Loss Setting Risk: Fixed-period high/low stops may not suit all market conditions
- Money Management Risk: Fixed risk-reward ratio may be too aggressive in certain markets
- Slippage Risk: Significant price deviation may occur during high volatility periods
Optimization Directions
- Trend Filter Integration: Add moving averages for trend-aligned trading
- Stop-Loss Optimization: Consider ATR for dynamic stop-loss adjustment
- Volume Confirmation: Include volume indicators for signal validation
- Market Environment Classification: Adjust risk-reward ratio based on market conditions
- Time Filtering: Avoid trading during low volatility periods
- Parameter Adaptation: Implement adaptive mechanisms for RSI parameters
Summary
The strategy creates a comprehensive trading system by combining RSI overbought/oversold signals with Bollinger Bands boundaries. Its core strengths lie in dynamic risk management and clear risk-reward ratio settings, though attention must be paid to false breakout risks and changing market conditions. Further improvements can be achieved through trend filtering, stop-loss optimization, and other suggested enhancements.
/*backtest
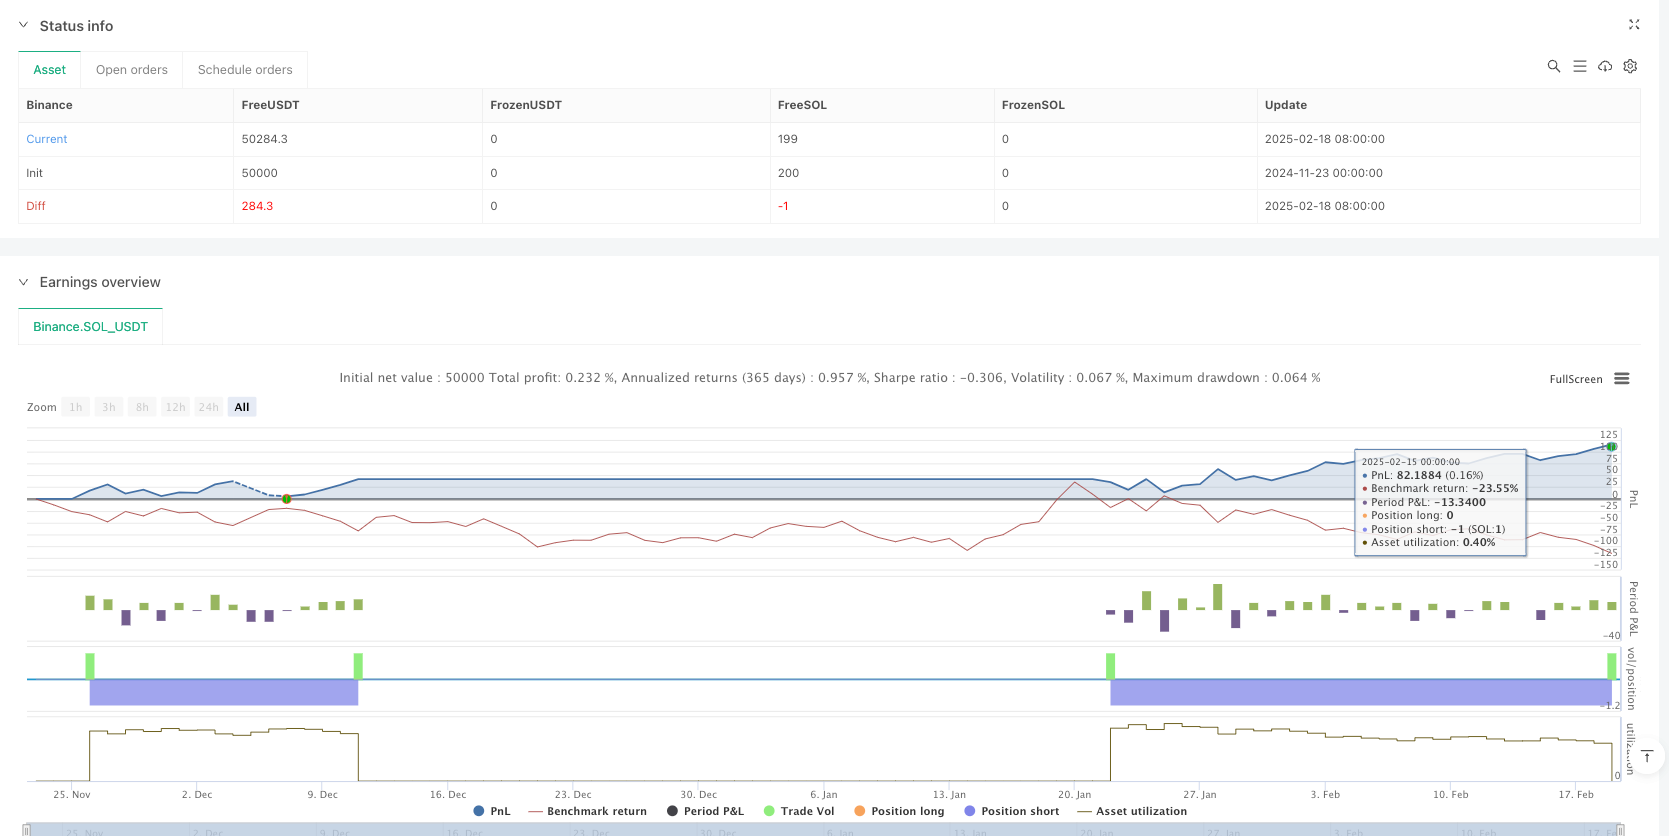
start: 2024-11-23 00:00:00
end: 2025-02-19 08:00:00
period: 1d
basePeriod: 1d
exchanges: [{"eid":"Binance","currency":"SOL_USDT"}]
*/
// This Pine Script™ code is subject to the terms of the Mozilla Public License 2.0 at https://mozilla.org/MPL/2.0/
// © humblehustle
//@version=5
strategy("RSI Oversold Crossover Strategy", overlay=true)
// === INPUT PARAMETERS ===
rsi_length = input(14, title="RSI Length")
rsi_overbought = input(70, title="RSI Overbought Level")
rsi_oversold = input(30, title="RSI Oversold Level")
// === RSI CALCULATION ===
rsi = ta.rsi(close, rsi_length)
// === ENTRY CONDITIONS ===
long_condition = ta.crossover(rsi, rsi_oversold) // RSI crosses above 30
short_condition = ta.crossunder(rsi, rsi_overbought) // RSI crosses below 70
// === STOP LOSS & TARGET CALCULATION ===
longStop = ta.lowest(low, 10) // Recent swing low for longs
shortStop = ta.highest(high, 10) // Recent swing high for shorts
longTarget = close + (close - longStop) * 2 // 2:1 Risk-Reward
shortTarget = close - (shortStop - close) * 2 // 2:1 Risk-Reward
// === EXECUTE TRADES ===
if long_condition
strategy.entry("Long", strategy.long)
strategy.exit("ExitLong", from_entry="Long", stop=longStop, limit=longTarget)
if short_condition
strategy.entry("Short", strategy.short)
strategy.exit("ExitShort", from_entry="Short", stop=shortStop, limit=shortTarget)
// === ALERTS ===
alertcondition(long_condition, title="Long Signal", message="BUY: RSI Crossed Above 30 (Oversold)")
alertcondition(short_condition, title="Short Signal", message="SELL: RSI Crossed Below 70 (Overbought)")
// === PLOTTING INDICATORS & SIGNALS ===
hline(rsi_overbought, "RSI Overbought", color=color.red)
hline(rsi_oversold, "RSI Oversold", color=color.green)
plot(rsi, title="RSI", color=color.blue, linewidth=2)
plotshape(series=long_condition, location=location.belowbar, color=color.green, style=shape.labelup, title="BUY Signal", size=size.large)
plotshape(series=short_condition, location=location.abovebar, color=color.red, style=shape.labeldown, title="SELL Signal", size=size.large)