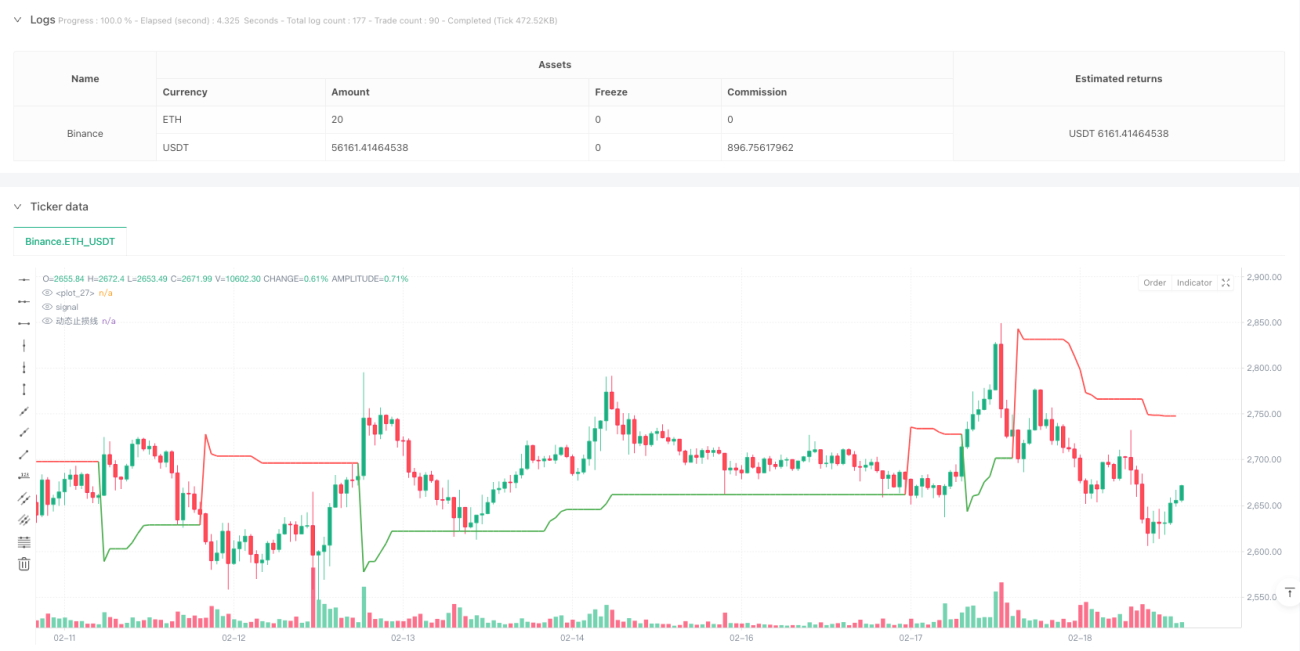
Advanced Quantitative Trading Strategy: Multi-Dimensional Super Trend ATR Dynamic Tracking System

Overview
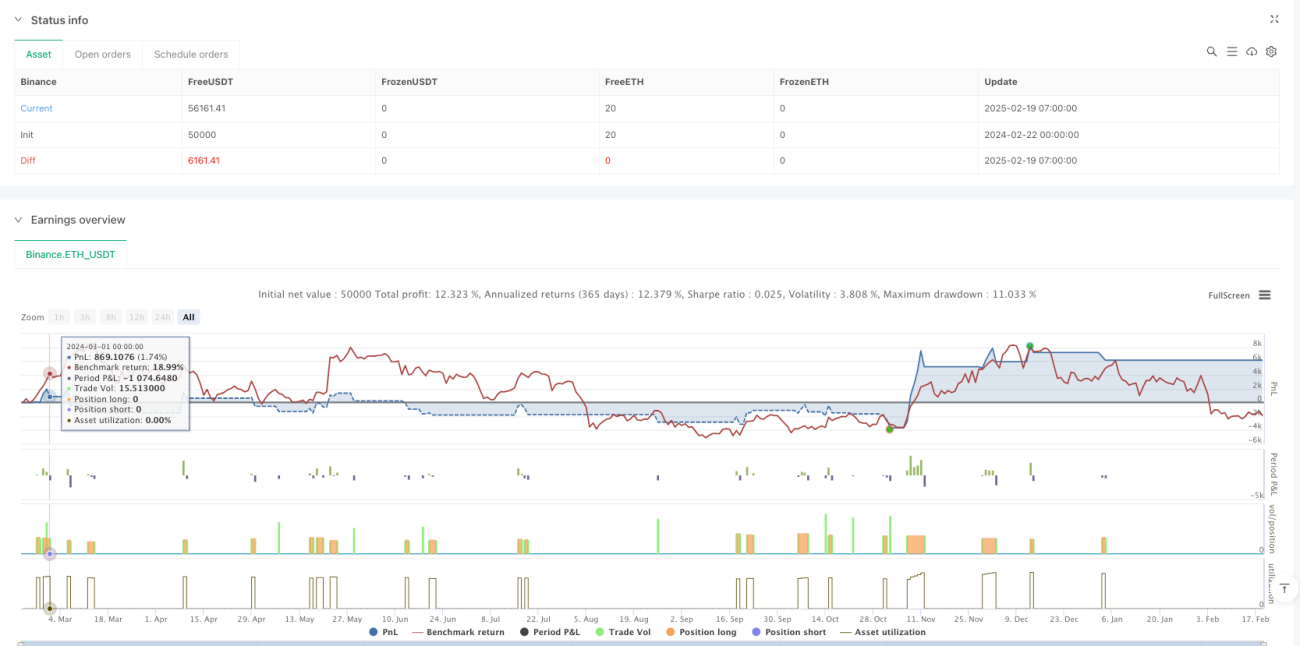
This strategy is a quantitative trading system based on multiple technical indicators, primarily driven by the SuperTrend indicator, combined with ATR dynamic stop-loss mechanism, and utilizing MACD, ADX, RSI, and other indicators for multi-dimensional trend confirmation and risk control. The strategy employs a six-layer filtering mechanism to identify high-probability trading opportunities while incorporating triple divergence detection for early market risk warning.
Strategy Principles
The strategy uses SuperTrend indicator as its core, calculating trend direction through factor and ATR parameters. Entry signals must satisfy the following conditions:
- SuperTrend direction indication
- MACD histogram position verification
- ADX trend strength confirmation
- Candlestick pattern confirmation
- Volume expansion verification
- Triple divergence detection
The system implements ATR dynamic stop-loss for risk control and manages positions based on trend reversal signals.
Strategy Advantages
- Multi-dimensional indicator fusion improves signal reliability
- ATR dynamic stop-loss mechanism adapts to market volatility
- Triple divergence detection system provides risk warnings
- Volume verification ensures trading activity
- Gas fee filtering mechanism reduces transaction costs
- Complete visualization system facilitates strategy monitoring
Strategy Risks
- Multiple filters may cause missed trading opportunities
- Parameter optimization faces overfitting risks
- High market volatility periods may trigger frequent stop-losses
- Gas fee fluctuations may affect strategy returns
- Indicator combinations may generate chaotic signals in sideways markets
Strategy Optimization Directions
- Introduce market cycle recognition module for parameter adaptation
- Develop machine learning-based signal weighting system
- Optimize Gas fee prediction model for better timing
- Add transaction cost calculation module
- Develop volatility-based position management system
Summary
This strategy constructs a robust quantitative trading system through multi-dimensional indicator fusion and strict risk control. The modular design facilitates subsequent optimization and expansion, but parameter tuning and market adaptability need attention in practical applications. Innovative designs such as triple divergence warning and Gas fee filtering further enhance the strategy's practicality.
/*backtest
start: 2024-02-22 00:00:00
end: 2025-02-19 08:00:00
period: 1h
basePeriod: 1h
exchanges: [{"eid":"Binance","currency":"ETH_USDT"}]
*/

//@version=6
strategy("ETH 超级趋势增强策略-精简版", overlay=true, initial_capital=10000, default_qty_type=strategy.percent_of_equity, default_qty_value=100)

// —————————— 参数配置区 ——————————- 1