
Overview
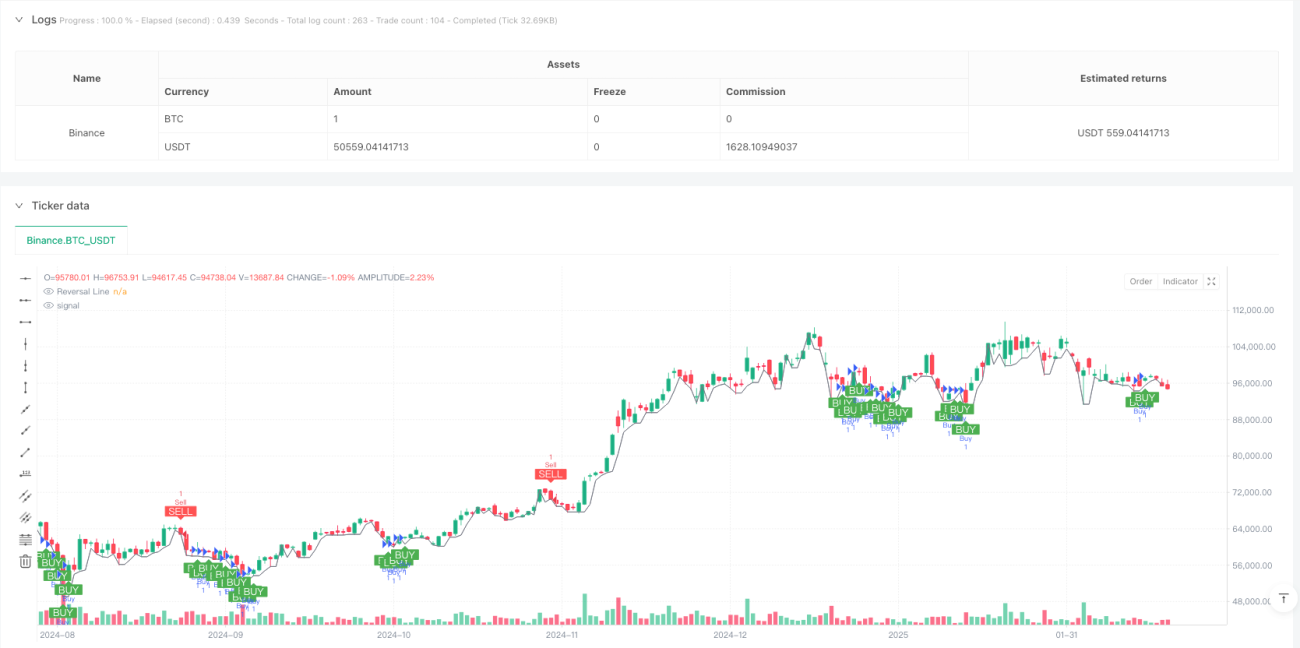
This strategy is an adaptive trading system that combines ZigZag percentage reversal with the Stochastic indicator. It identifies key reversal points through dynamic market volatility calculation and determines trading opportunities using Stochastic overbought/oversold signals. The strategy incorporates automatic take-profit and stop-loss mechanisms for effective risk management.
Strategy Principles
The core mechanism uses percentage reversal method to dynamically track market trends. Users can choose between manual setting of reversal percentage or dynamic calculation based on ATR across different periods (5-250 days). Buy signals are generated when price breaks above the reversal line with Stochastic K value below 30; sell signals occur when price breaks below the reversal line with K value above 70. The system automatically sets take-profit and stop-loss levels to protect profits and control risks.
Strategy Advantages
- Dynamic adaptive reversal calculation method better suits different market conditions
- Integration of trend reversal and momentum indicators provides more reliable trading signals
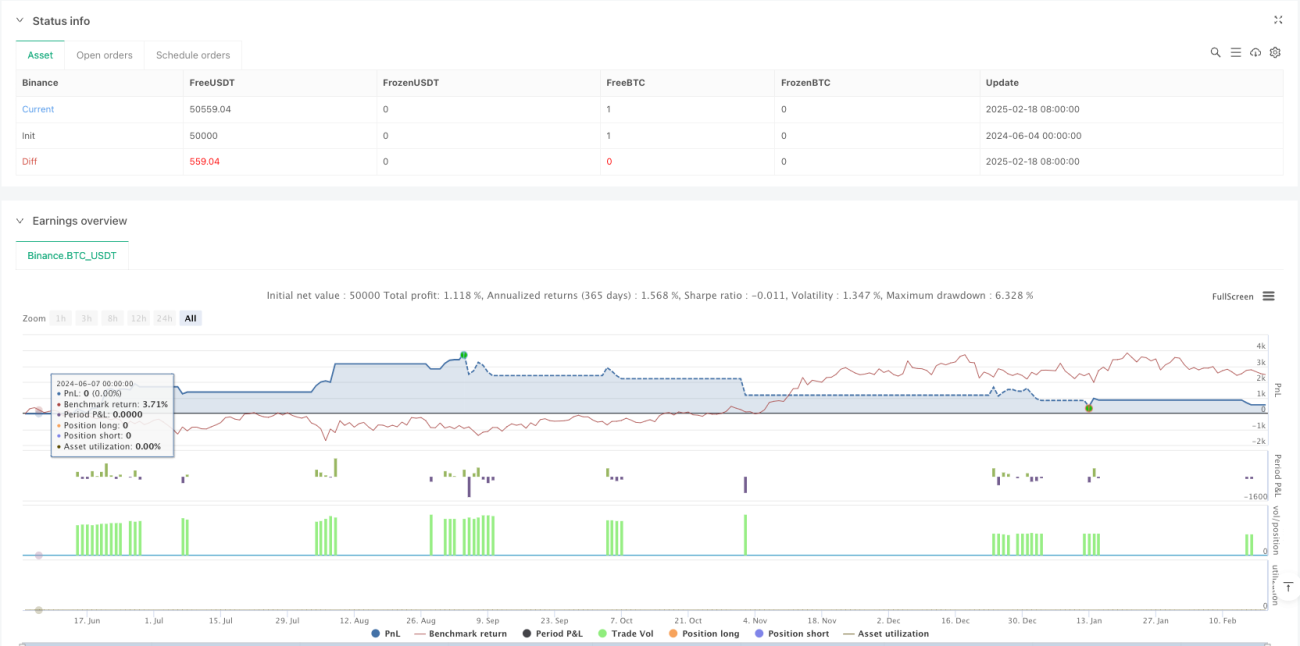
- Built-in take-profit and stop-loss mechanisms help traders manage risk automatically
- Flexible parameter settings allow traders to optimize according to personal trading styles
- Visualized trading signals facilitate analysis and decision-making
Strategy Risks
- May generate frequent false signals in ranging markets
- ATR period selection impacts strategy performance
- Fixed take-profit and stop-loss levels may not suit all market conditions
- Stochastic indicator may lag in certain market conditions
- Requires proper parameter setting to avoid overtrading
Strategy Optimization Directions
- Introduce multiple timeframe analysis to improve signal reliability
- Implement dynamic adjustment of take-profit and stop-loss levels for better market adaptation
- Add volume indicators as confirmation signals
- Develop adaptive Stochastic indicator parameters
- Include trend strength filters to reduce false signals
Summary
This is a modernized trading strategy combining classic technical analysis tools. By integrating ZigZag reversal, Stochastic indicator, and risk management, it provides traders with a comprehensive trading system. The strategy's high customizability makes it suitable for traders with different risk preferences. Continuous optimization and parameter adjustment can further enhance the strategy's stability and profitability.
- 1