
Overview
This strategy is an intelligent trading system based on multiple technical indicators, combining Bollinger Bands, Stochastic Oscillator, and Average True Range (ATR) to identify potential trading opportunities through comprehensive analysis of market volatility, momentum, and trends. The strategy employs dynamic stop-loss and profit targets that adapt to market volatility conditions.
Strategy Principles
The core logic is based on a triple verification mechanism:
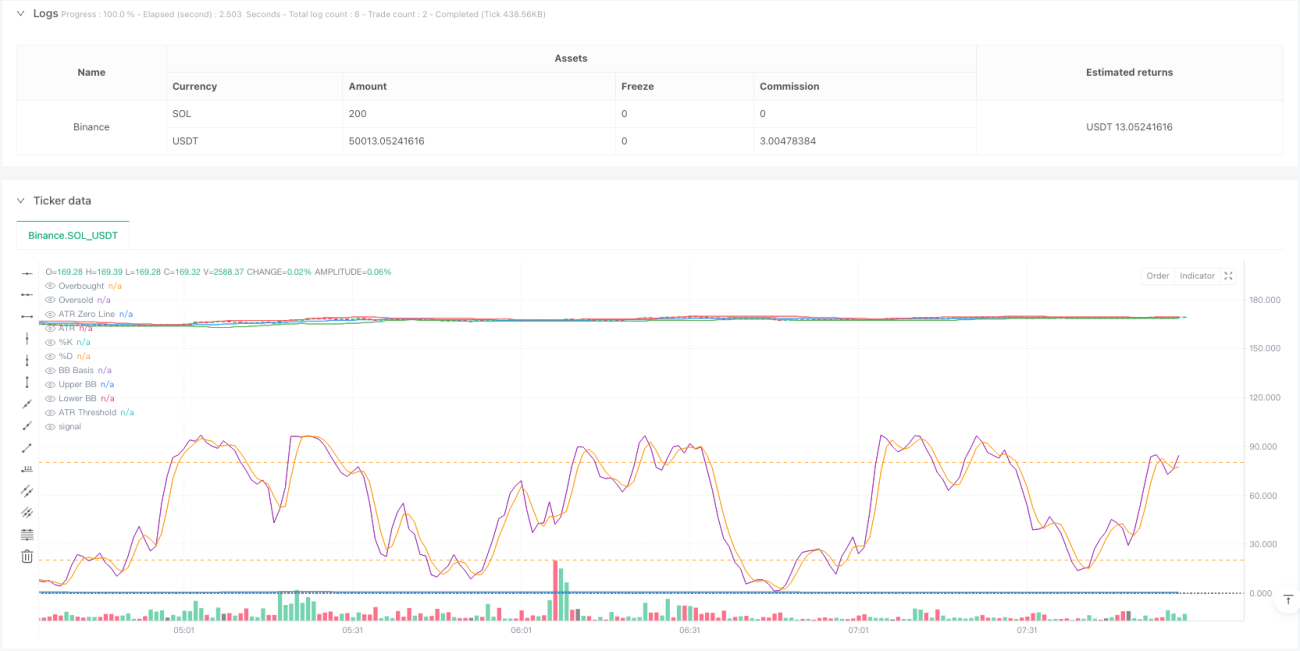
- Using Bollinger Bands to define price volatility ranges, identifying oversold opportunities when price breaks below the lower band and overbought opportunities when it breaks above the upper band
- Momentum confirmation through Stochastic Oscillator in overbought (>80) and oversold (<20) regions, with %K and %D line crossovers as entry signals
- Incorporating ATR as a volatility filter to ensure trades are executed under sufficient market volatility
Trade signals require the following conditions:
Buy conditions:
- Price closes below the lower Bollinger Band
- Stochastic %K line crosses above %D line in the oversold region
- ATR value exceeds the set threshold, confirming adequate market volatility
Sell conditions:
- Price closes above the upper Bollinger Band
- Stochastic %K line crosses below %D line in the overbought region
- ATR value maintains above threshold, confirming trade validity
Strategy Advantages
- Multiple technical indicator cross-validation significantly improves trading signal reliability
- Dynamic stop-loss and profit targets that automatically adjust risk management parameters based on market volatility
- Volatility filtering mechanism effectively avoids false signals during low volatility periods
- Indicator parameters can be flexibly adjusted for different market conditions, providing good adaptability
- Clear strategy logic that is easy to understand and implement, suitable for traders of all levels
Strategy Risks
- Potential slippage during intense market volatility affecting actual execution prices
- Multiple indicators may lead to signal lag, missing optimal entry points
- Over-optimization of parameters may result in overfitting, impacting strategy performance in live trading
- False signals may occur at trend turning points, requiring complementary analysis tools
- Trading costs and commissions may affect overall strategy returns
Strategy Optimization Directions
- Introduce trend filters, such as moving average crossover systems, to enhance trend confirmation
- Optimize the dynamic adjustment mechanism of ATR threshold for better adaptation to different market environments
- Add volume indicator verification to improve trading signal reliability
- Implement adaptive parameter optimization that automatically adjusts indicator parameters based on market conditions
- Add time filters to avoid trading during highly volatile market opening and closing periods
Summary
The strategy constructs a complete trading system through the combined application of Bollinger Bands, Stochastic Oscillator, and ATR. Its strengths lie in multiple indicator cross-validation and dynamic risk management, while attention must be paid to parameter optimization and market environment adaptability. Through continuous optimization and refinement, the strategy shows promise for achieving stable returns in actual trading.
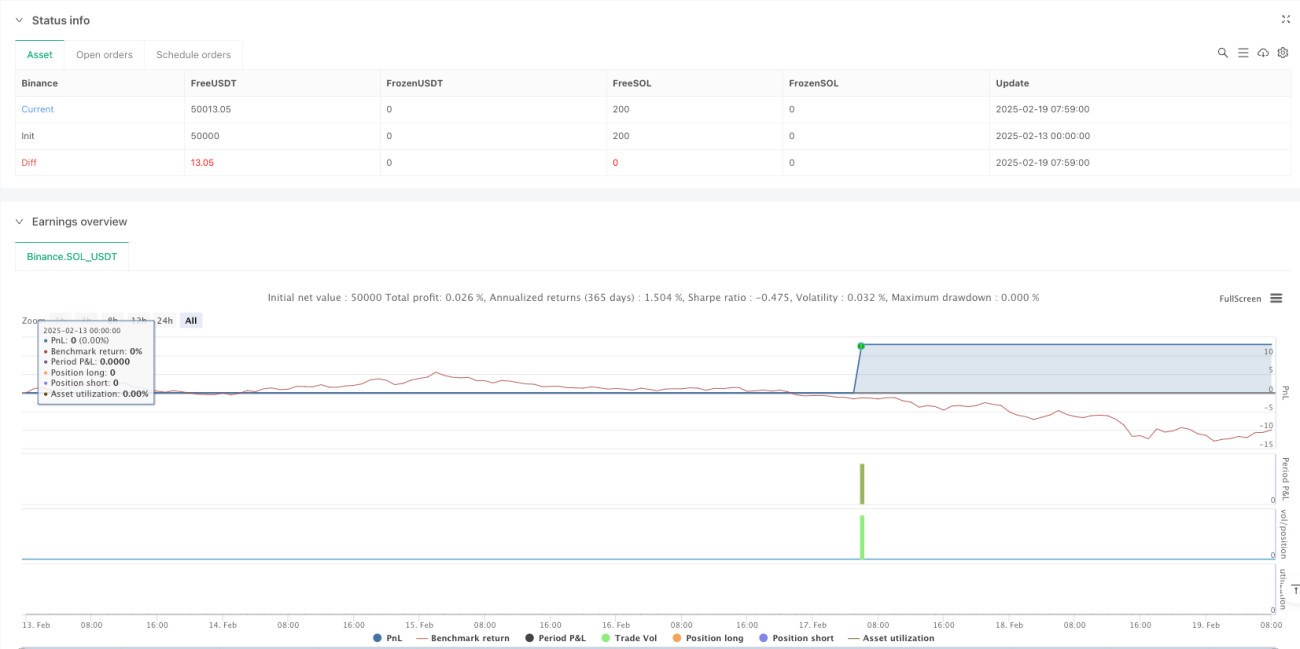
/*backtest
start: 2025-02-13 00:00:00
end: 2025-02-19 08:00:00
period: 1m
basePeriod: 1m
exchanges: [{"eid":"Binance","currency":"SOL_USDT"}]
*/

//@version=5
strategy("Bollinger Bands + Stochastic Oscillator + ATR Strategy", overlay=true, default_qty_type=strategy.percent_of_equity, default_qty_value=10)

// Bollinger Bands Parameters- 1