Advanced Supertrend Indicator Trading Mechanism Optimization Strategy

Overview
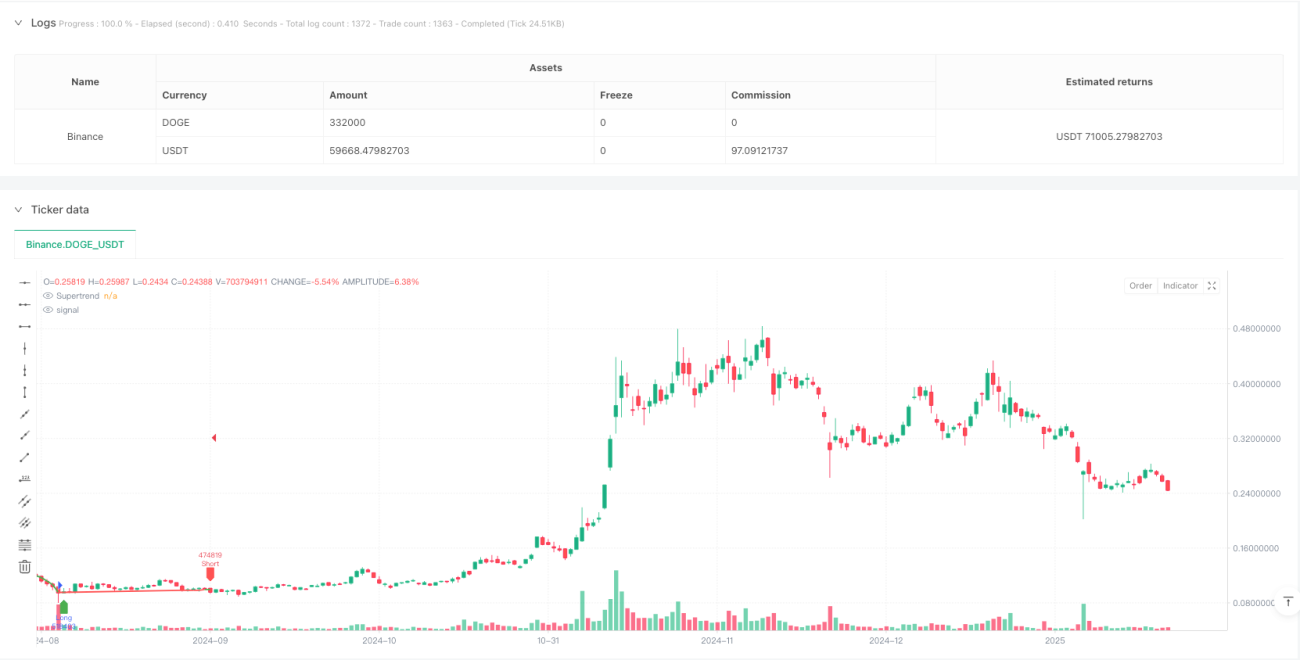
This strategy is an advanced trading system based on the Supertrend indicator, which identifies market buy and sell signals through trend change confirmation and price action analysis. The strategy employs a dynamic trend-following mechanism combined with price breakthrough verification to effectively capture market trend turning points.
Strategy Principle
The strategy is based on several key elements:
- Uses the Supertrend indicator as the primary trend determination tool, with parameters set to length 6 and factor 0.25
- Captures potential trading opportunities by monitoring changes in Supertrend direction
- Employs a price breakthrough confirmation mechanism, requiring closing price to break through the Supertrend line to trigger trading signals
- Enters long positions when price breaks above the Supertrend line in uptrends
- Enters short positions when price breaks below the Supertrend line in downtrends
- Uses a dynamic trend-following exit mechanism, closing positions based on reverse signals
Strategy Advantages
- Trend confirmation mechanism effectively reduces false signals and improves trading accuracy
- Integration with price action analysis enhances signal reliability
- Clear visual signal display facilitates quick identification of trading opportunities
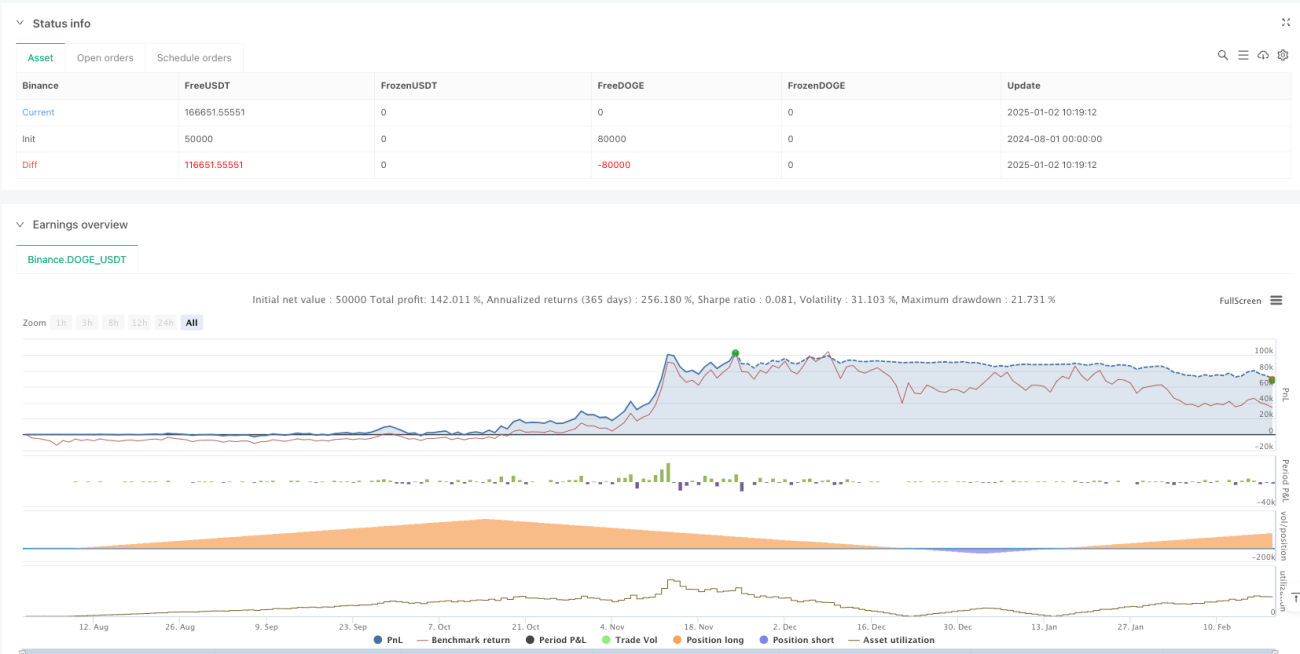
- Employs percentage-based position management for better risk control
- Alert system implemented for timely signal notifications
- Simple and clear strategy logic, easy to understand and execute
Strategy Risks
- May generate frequent false breakthrough signals in ranging markets
- Lag in trend transition points might lead to delayed entry timing
- Fixed parameter settings may not be suitable for all market conditions
- Lacks dynamic adjustment mechanism for market volatility changes
- Absence of stop-loss mechanism may result in significant losses during violent fluctuations
- Single indicator dependency might overlook other important market information
Strategy Optimization Directions
- Introduce volatility indicators (such as ATR) for dynamic Supertrend parameter adjustment
- Add multiple timeframe confirmation mechanism to improve signal reliability
- Integrate other technical indicators (like RSI or MACD) for signal filtering
- Develop adaptive position management system
- Implement dynamic stop-loss mechanism for better risk control
- Add market environment recognition functionality to adjust strategy parameters under different market conditions
Summary
The strategy builds a relatively reliable trading system by combining the Supertrend indicator with price action analysis. While there are some potential risks, the strategy's stability and profitability can be further enhanced through the suggested optimization directions. Successful implementation requires traders to deeply understand market conditions and flexibly adjust parameters based on actual situations.
/*backtest
start: 2024-08-01 00:00:00
end: 2025-02-19 08:00:00
period: 1d
basePeriod: 1d
exchanges: [{"eid":"Binance","currency":"DOGE_USDT"}]
*/

//@version=5
strategy("Supertrend Strategy with Money Ocean Trade", overlay=true, default_qty_type=strategy.percent_of_equity, default_qty_value=100)

// Input parameters- 1