Overview
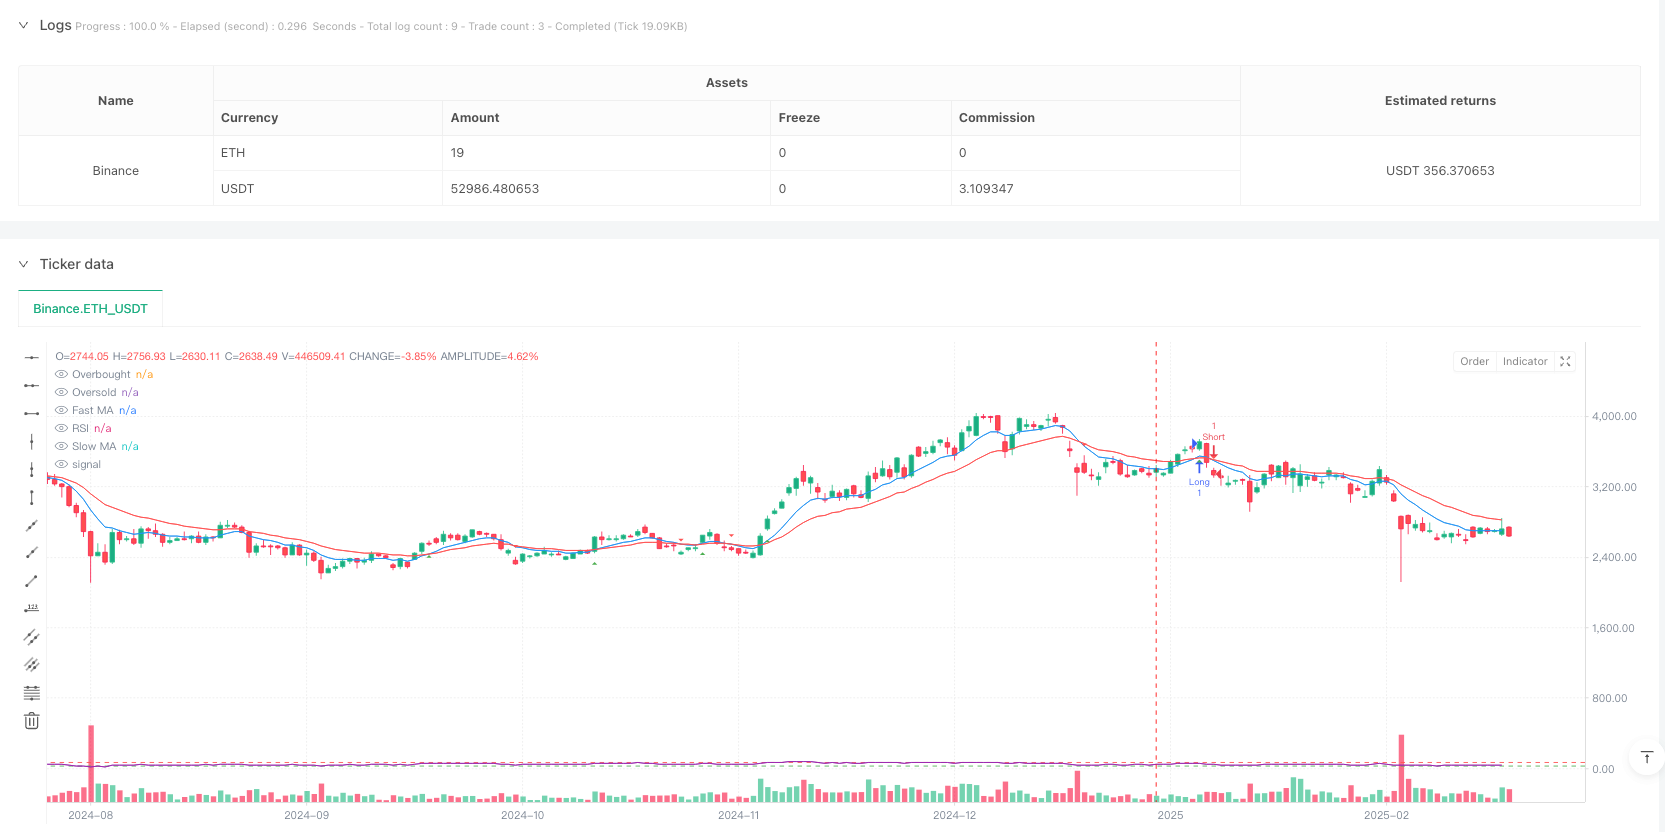
This strategy is a trading system that combines dual moving average crossover with the Relative Strength Index (RSI). It utilizes 9-period and 21-period Exponential Moving Averages (EMA) as the primary signal generation tool, while incorporating the RSI indicator as a filter to avoid trading in overbought/oversold regions. This combination maintains trend-following characteristics while adding a momentum confirmation dimension.
Strategy Principle
The core logic of the strategy is based on the following key components: 1. Crossover signals between fast EMA (9-period) and slow EMA (21-period) 2. RSI indicator (14-period) as a filter, with 70 and 30 as overbought and oversold thresholds 3. Buy condition: fast EMA crosses above slow EMA and RSI is below 70 4. Sell condition: fast EMA crosses below slow EMA and RSI is above 30 This approach ensures trend signal reliability while avoiding trades during market extremes.
Strategy Advantages
- Signal Reliability: Combines trend and momentum dimensions to enhance trading signal reliability
- Risk Control: RSI filter effectively prevents trading in overbought/oversold regions
- High Adaptability: Strategy parameters can be adjusted for different market conditions
- High Automation: Includes complete signal generation and alert functionality
- Good Visualization: Provides clear graphical interface for better market state understanding
Strategy Risks
- Lag Risk: Moving averages are inherently lagging indicators, potentially causing delays in fast-moving markets
- False Breakout Risk: May generate frequent false signals in ranging markets
- Parameter Sensitivity: Strategy effectiveness is sensitive to parameter settings, different market environments may require different parameter combinations
- Market Environment Dependency: Performs better in trending markets, may underperform in ranging markets
Strategy Optimization Directions
- Incorporate Volatility Indicators: Consider adding ATR or Bollinger Bands to adapt to different market volatility environments
- Optimize Signal Filtering: Consider adding volume indicators as additional confirmation
- Dynamic Parameter Adjustment: Develop adaptive parameter systems that automatically adjust based on market conditions
- Add Stop Loss Mechanism: Implement dynamic stop loss functionality to improve risk management
- Timeframe Optimization: Consider multiple timeframe analysis to improve signal reliability
Summary
This strategy constructs a comprehensive trading system by combining classic technical analysis tools. It captures trends through moving average crossovers and filters signals using RSI, achieving an organic combination of trend following and momentum confirmation. The strategy’s main advantages lie in its reliability and risk control capabilities, but attention must be paid to the lag in moving averages and parameter setting sensitivity. Through the proposed optimization directions, there is room for further strategy improvement.
/*backtest
start: 2025-01-01 00:00:00
end: 2025-02-19 08:00:00
period: 1d
basePeriod: 1d
exchanges: [{"eid":"Binance","currency":"ETH_USDT"}]
*/

// This Pine Script™ code is subject to the terms of the Mozilla Public License 2.0 at https://mozilla.org/MPL/2.0/
// © McTunT

// Gold Price Trading Signals
// Pine Script version 6 code for TradingView
//@version=6
strategy("Ausiris Gold Trading Strategy", overlay=true)

// Input parameters
fastLength = input.int(9, title="Fast MA Length", minval=1)
slowLength = input.int(21, title="Slow MA Length", minval=1)
rsiLength = input.int(14, title="RSI Length", minval=1)
rsiOverbought = input.int(70, title="RSI Overbought Level", minval=50, maxval=100)
rsiOversold = input.int(30, title="RSI Oversold Level", minval=0, maxval=50)

// Calculate moving averages
fastMA = ta.ema(close, fastLength)
slowMA = ta.ema(close, slowLength)

// Calculate RSI
rsiValue = ta.rsi(close, rsiLength)

// Plot moving averages
plot(fastMA, color=color.blue, title="Fast MA")
plot(slowMA, color=color.red, title="Slow MA")

// Generate signals
longCondition = ta.crossover(fastMA, slowMA) and rsiValue < rsiOverbought
shortCondition = ta.crossunder(fastMA, slowMA) and rsiValue > rsiOversold

// Plot buy/sell signals
plotshape(longCondition, title="Buy Signal", location=location.belowbar, color=color.green, style=shape.triangleup, size=size.small)
plotshape(shortCondition, title="Sell Signal", location=location.abovebar, color=color.red, style=shape.triangledown, size=size.small)

// Strategy entry/exit
if (longCondition)
    strategy.entry("Long", strategy.long)
if (shortCondition)
    strategy.entry("Short", strategy.short)

// Add alert conditions
alertcondition(longCondition, title="Buy Alert", message="Gold Buy Signal!")
alertcondition(shortCondition, title="Sell Alert", message="Gold Sell Signal!")

// Display RSI values
hline(rsiOverbought, "Overbought", color=color.red)
hline(rsiOversold, "Oversold", color=color.green)
plot(rsiValue, "RSI", color=color.purple, display=display.none)