Dynamic Trend Momentum Crossover Strategy - Quantitative Trading System Based on Dual EMA and MACD Indicators

Overview
This strategy is a quantitative trading system that combines Exponential Moving Averages (EMA) and Moving Average Convergence Divergence (MACD) indicators. By integrating crossover signals from short-term and long-term EMAs with MACD momentum confirmation, it provides traders with a comprehensive trend-following solution. The strategy also includes dynamic stop-loss and take-profit mechanisms for effective risk control while maximizing potential returns.
Strategy Principles
The core logic is based on the synergy of two technical indicators. First, it uses 12-period and 26-period EMAs to identify market trends, generating long signals when the short-term EMA crosses above the long-term EMA, and short signals when it crosses below. Second, it uses the MACD indicator (12,26,9 settings) to confirm trend momentum, requiring the MACD line and Signal line relationship to support the EMA-generated trading signals. The system employs percentage-based dynamic stop-loss (default 2%) and take-profit (default 5%) levels, with additional exit signals triggered by EMA crossovers or MACD reversals.
Strategy Advantages
- Robust signal confirmation: Dual confirmation through EMA crossovers and MACD momentum significantly reduces false breakout risks
- Flexible risk management: Percentage-based stop-loss and take-profit levels easily adaptable to different market conditions and instruments
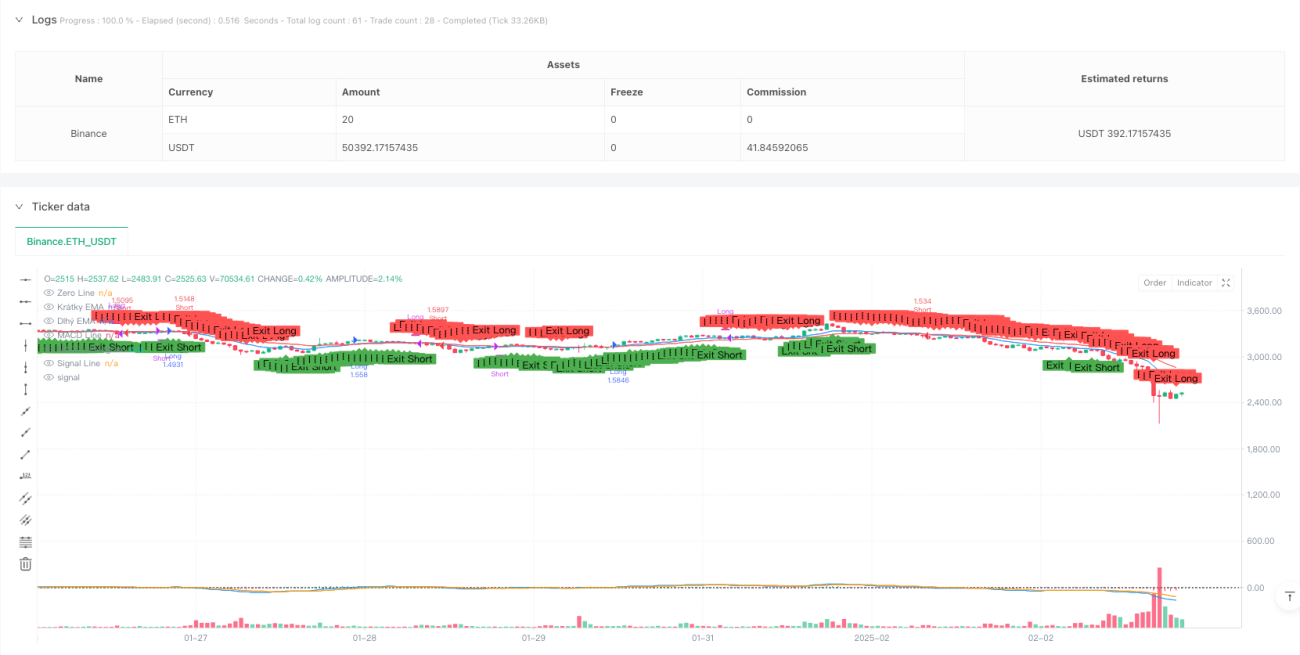
- Excellent visualization: Clear display of EMA lines, MACD indicator, and trade signal markers on charts
- Strong parameterization: Allows adjustment of EMA periods, MACD parameters, and risk control ratios to adapt to different trading strategies
Strategy Risks
- Trend reversal risk: May generate frequent crossovers in ranging markets, leading to false signals
- Lagging indicator issue: Both EMA and MACD are lagging indicators, potentially missing optimal entry points in fast-moving markets
- Money management risk: Fixed percentage stops may not be flexible enough in high-volatility environments
- Parameter optimization risk: Over-optimization may lead to poorer live trading performance compared to backtests
Optimization Directions
- Incorporate volatility indicators: Suggest adding ATR indicator for dynamic stop-loss and take-profit adjustments
- Add market environment filters: Consider using ADX or similar indicators to gauge trend strength and avoid ranging markets
- Enhance signal confirmation: Consider adding volume confirmation or other momentum indicators as auxiliary signals
- Improve money management: Implement dynamic position sizing based on account equity
Summary
This is a well-designed, logically sound trend-following strategy. By combining the strengths of EMA and MACD, it achieves a reliable trade signal generation mechanism while maintaining simplicity and clarity. The strategy offers strong customization options and robust risk management mechanisms, making it suitable as a foundation for medium to long-term trend trading. Traders are advised to thoroughly test parameter settings and optimize the strategy according to specific trading instruments and market conditions before live implementation.
- 1