
Overview
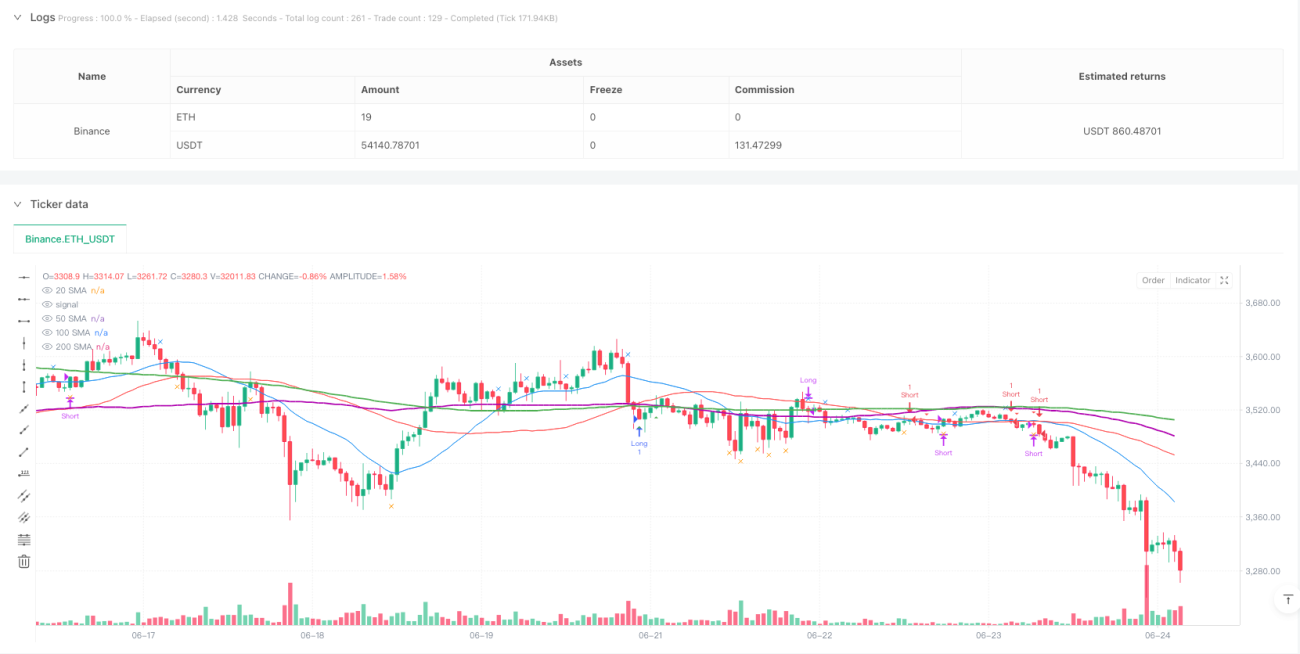
This strategy is a trend following system based on multiple Simple Moving Averages (SMA) combined with precise tick cross detection technology. It determines market trends through the hierarchical relationship of 20, 50, 100, and 200-period moving averages, and triggers trading signals using real-time price crosses with moving averages. The strategy is designed to be universally applicable across different time zones and trading sessions, capable of running on charts of various timeframes.
Strategy Principle
The strategy employs a three-layer trend filtering mechanism, requiring the 50-period moving average to be above the 100-period moving average, which in turn must be above the 200-period moving average to confirm an uptrend, and vice versa for a downtrend. Entry signals are based on price crosses with the 50-period moving average, using tick data for precise cross detection by comparing current price action with the previous bar's position. Exit signals are determined by the relationship between price and the 20-period moving average, triggering position closure when price breaks through the 20-period moving average.
Strategy Advantages
- Precise cross detection mechanism improves the accuracy of trading timing
- Multi-layer moving average trend confirmation effectively filters false signals
- Strategy has good timezone adaptability and can be used in any global market
- Entry and exit logic is unified and clear, easy to understand and execute
- Applicable to multiple timeframe charts, demonstrating strong universality
Strategy Risks
- May generate frequent false signals in ranging markets, leading to overtrading
- Moving averages have inherent lag, potentially missing important turning points
- Tick cross detection may produce excessive signals in highly volatile markets
- Multi-layer trend filtering might miss some potential trading opportunities
- Fixed exit conditions may result in larger drawdowns during severe volatility
Strategy Optimization Directions
- Introduce volatility indicators to dynamically adjust entry and exit conditions
- Add volume confirmation mechanism to enhance cross signal reliability
- Design dynamic stop-loss mechanism for better risk control
- Incorporate market structure analysis to optimize trend judgment accuracy
- Develop adaptive parameter optimization mechanism to improve strategy stability
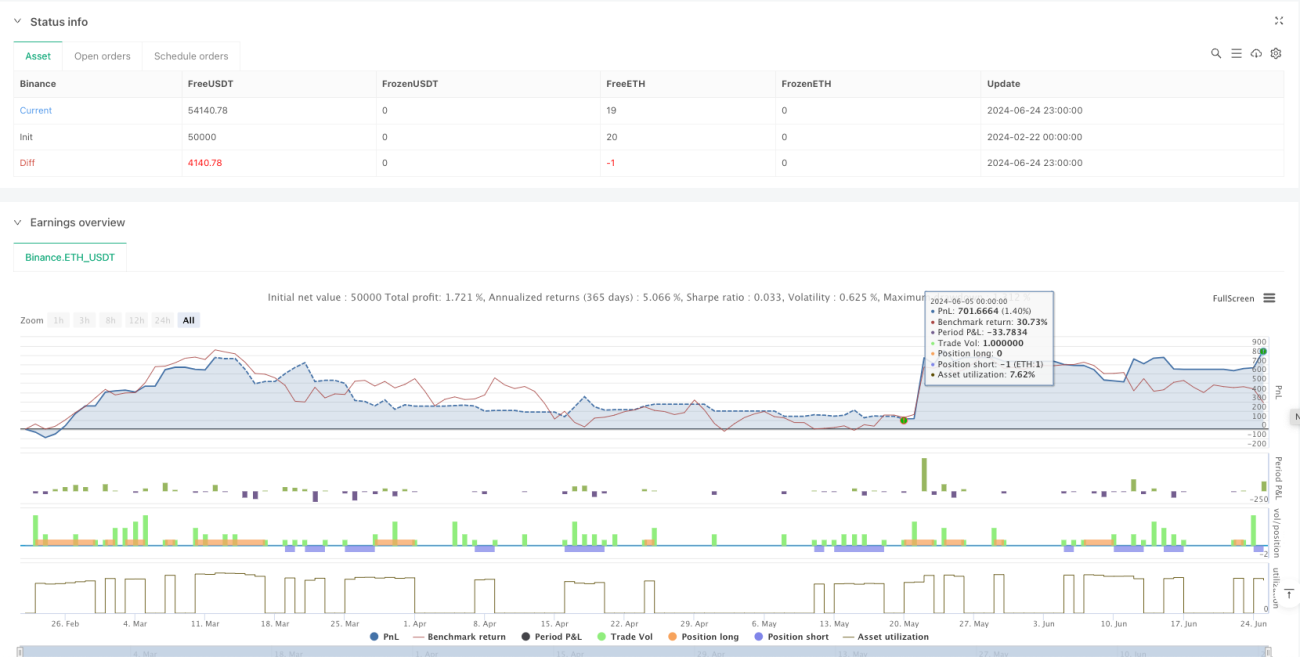
Summary
This is a well-structured trend following strategy with clear logic that ensures signal reliability and effective trend tracking through the coordinated use of multiple moving averages. The strategy's design considers practicality and universality, making it suitable for use in different market environments. Through further optimization and refinement, this strategy has the potential to achieve better performance in actual trading.
- 1