
Overview
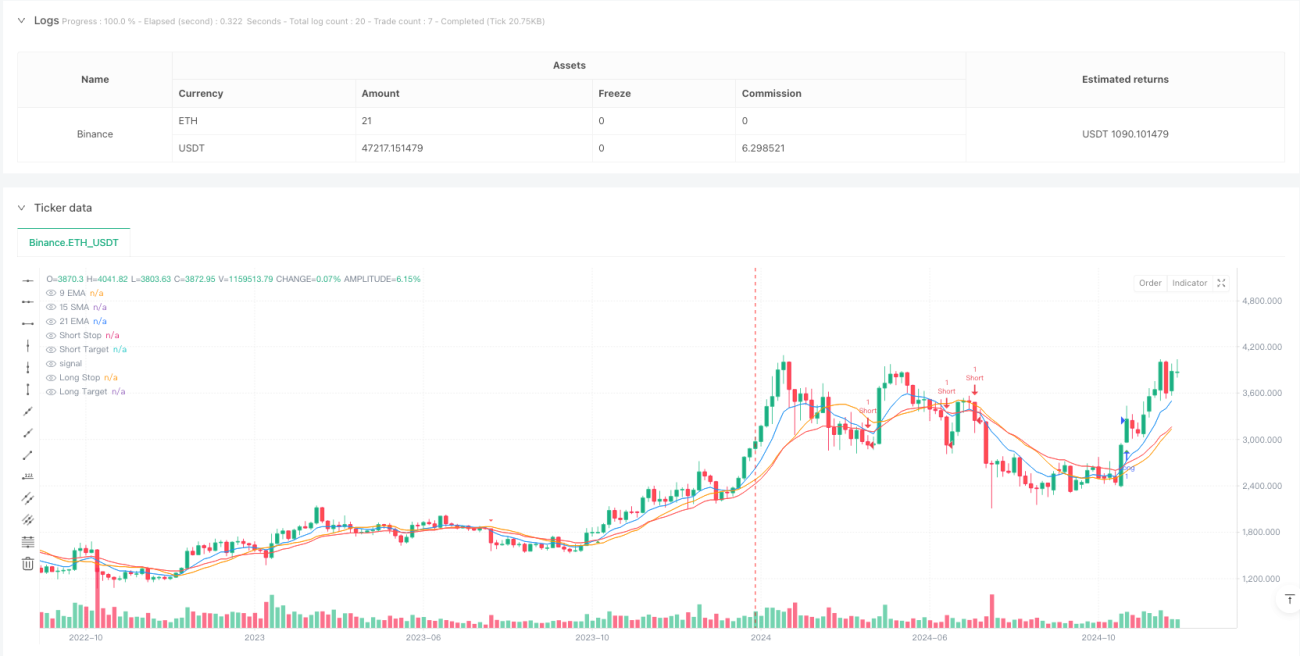
This strategy is a quantitative trading system that combines moving average (MA) crossovers with trend following. It utilizes a 15-period Simple Moving Average (SMA) as a trend filter, while using the crossover of 9-period and 21-period Exponential Moving Averages (EMA) to generate trading signals. The strategy employs strict entry conditions and a fixed 1:4 risk-reward ratio for risk management.
Strategy Principles
The core logic of the strategy is based on the following key elements:
- Trend Confirmation: Uses 15-period SMA as the primary trend indicator. Price above 15 SMA indicates uptrend, while below indicates downtrend.
- Trading Signals: Triggers trades through 9 EMA and 21 EMA crossovers. Long signals are generated when 9 EMA crosses above 21 EMA with other conditions met; short signals when 9 EMA crosses below 21 EMA with conditions met.
- Confirmation Conditions: Long entries require two consecutive bullish candles with both EMAs above 15 SMA; short entries require a bearish candle with both EMAs below 15 SMA.
- Risk Management: System automatically calculates stop-loss and profit targets using a 1:4 risk-reward ratio.
Strategy Advantages
- Strong Trend Following Capability: The 15 SMA trend filtering mechanism effectively avoids trading in ranging or counter-trend markets.
- Multiple Confirmation Mechanism: Combines moving average crossovers, candlestick patterns, and trend confirmation to reduce false signals.
- Comprehensive Risk Management: Fixed risk-reward ratio and automatic stop-loss/profit targets support long-term stability.
- Clear Visual Feedback: System provides clear visual indicators including trade signal markers and stop-loss/profit target levels.
Strategy Risks
- Lag Risk: Moving averages are inherently lagging indicators, potentially slow to react to rapid market reversals.
- False Breakout Risk: May generate false crossover signals in ranging markets.
- Fixed Risk Ratio Limitations: The 1:4 fixed risk-reward ratio may not suit all market conditions.
- Consecutive Loss Risk: May experience consecutive stops in choppy markets.
Strategy Optimization Directions
- Dynamic Period Optimization: Automatically adjust moving average periods based on market volatility.
- Volatility Filtering: Add ATR or other volatility indicators to optimize entry timing.
- Dynamic Risk Management: Adjust risk-reward ratio based on market conditions.
- Enhanced Market Context: Incorporate trend strength indicators to optimize trading conditions.
Summary
This is a well-designed, logically rigorous trend following strategy. Through the combination of multiple technical indicators and strict risk management, the strategy demonstrates good practicality. While inherent risks exist, the suggested optimization directions can further enhance strategy stability and profitability. The strategy is particularly suitable for trending markets and recommended for medium to long-term timeframes.
- 1