Multi-Indicator Cross-Intelligence Trend Trading Strategy

Overview
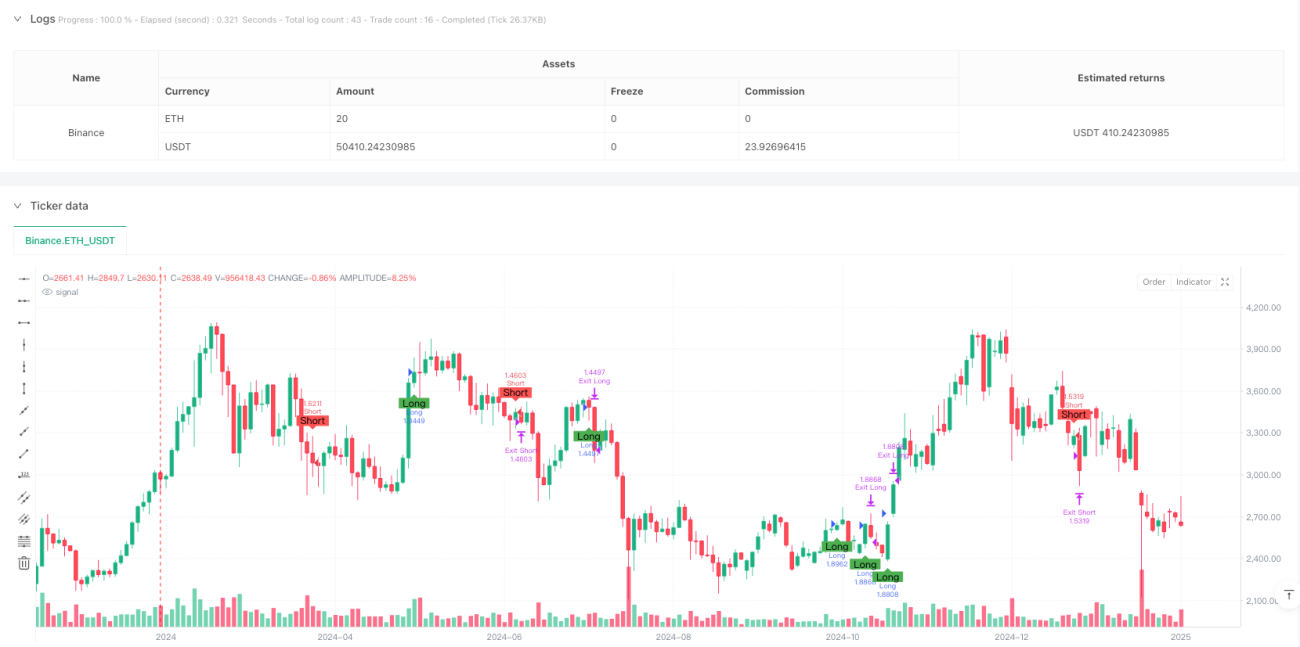
This is an intelligent trend-following strategy based on multiple technical indicator crossover signals. The strategy integrates three major technical indicators: Exponential Moving Average (EMA), Relative Strength Index (RSI), and Moving Average Convergence Divergence (MACD) to identify market trends through multi-dimensional signal confirmation, coupled with dynamic stop-loss and take-profit for risk management. The strategy is designed for fully automated trading and is particularly suitable for intraday trading.
Strategy Principles
The core logic is based on three layers of technical indicator filtering:
- Using 9-period and 21-period EMA crossovers to confirm trend direction
- Utilizing RSI to filter overbought and oversold areas, avoiding entry in extreme market conditions
- Further confirming trend strength and direction through MACD indicator
Entry signals require simultaneous satisfaction of the following conditions:
- Long conditions: Short-term EMA crosses above long-term EMA, RSI below 70, and MACD line above signal line
- Short conditions: Short-term EMA crosses below long-term EMA, RSI above 30, and MACD line below signal line
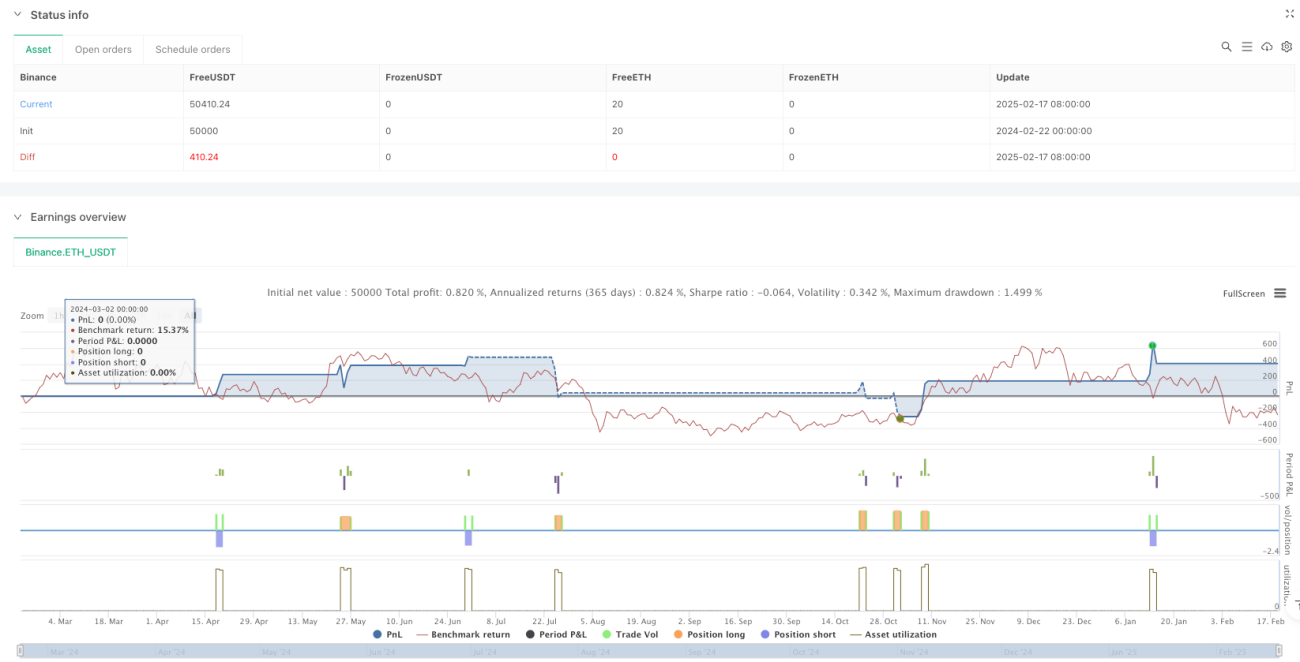
The strategy employs a percentage-based position sizing model, using 10% of account equity per trade, with 2% take-profit and 1% stop-loss for risk control.
Strategy Advantages
- Multiple indicator cross-validation significantly reduces false signal risk
- Dynamic stop-loss and take-profit levels automatically adjust based on entry price
- Percentage-based position management optimizes capital utilization
- Fully automated execution eliminates emotional interference
- Comprehensive risk management system including position control and stop-loss/take-profit mechanisms
Strategy Risks
- Multiple indicators may lead to signal lag, missing opportunities in fast markets
- Fixed percentage stop-loss and take-profit may trigger prematurely in highly volatile markets
- Reliance on technical indicators may generate excessive false signals in ranging markets
- Commission costs significantly impact strategy returns
Risk control suggestions:
- Dynamically adjust stop-loss and take-profit percentages based on market volatility
- Add trend strength filters to reduce trading frequency in ranging markets
- Optimize holding time management to avoid overnight risks
Strategy Optimization Directions
- Indicator Parameter Optimization
- Optimize EMA periods to find the best short-term and long-term period combinations
- Adjust RSI overbought/oversold thresholds to adapt to different market environments
- Optimize MACD parameters to improve trend identification accuracy
- Risk Management Optimization
- Implement dynamic stop-loss and take-profit percentages based on market volatility
- Add maximum drawdown control mechanism
- Introduce time-based exit mechanism to avoid long-term trapped positions
- Trade Execution Optimization
- Add volume filters to avoid trading in low liquidity environments
- Implement scaled entry and exit mechanisms to optimize average cost
- Incorporate market volatility indicators to dynamically adjust position sizes
Summary
The strategy constructs a relatively complete trend-following system through the synergy of multiple technical indicators. Its strengths lie in high signal reliability and comprehensive risk management, though it faces certain limitations in terms of lag and market environment dependency. Through the suggested optimization directions, the strategy can further enhance its adaptability and stability. For live trading application, it is recommended to conduct thorough backtesting and parameter optimization, making appropriate adjustments based on actual market conditions.
- 1