Overview
This is a trading strategy based on intraday price high-low breakouts, incorporating the ATR indicator for dynamic adjustment of stop-loss and profit targets. The strategy monitors the previous and current day’s highest and lowest prices, executing trades when prices break through these key levels. It introduces a buffer concept to reduce false signals and uses ATR multipliers for dynamic risk management parameters.
Strategy Principle
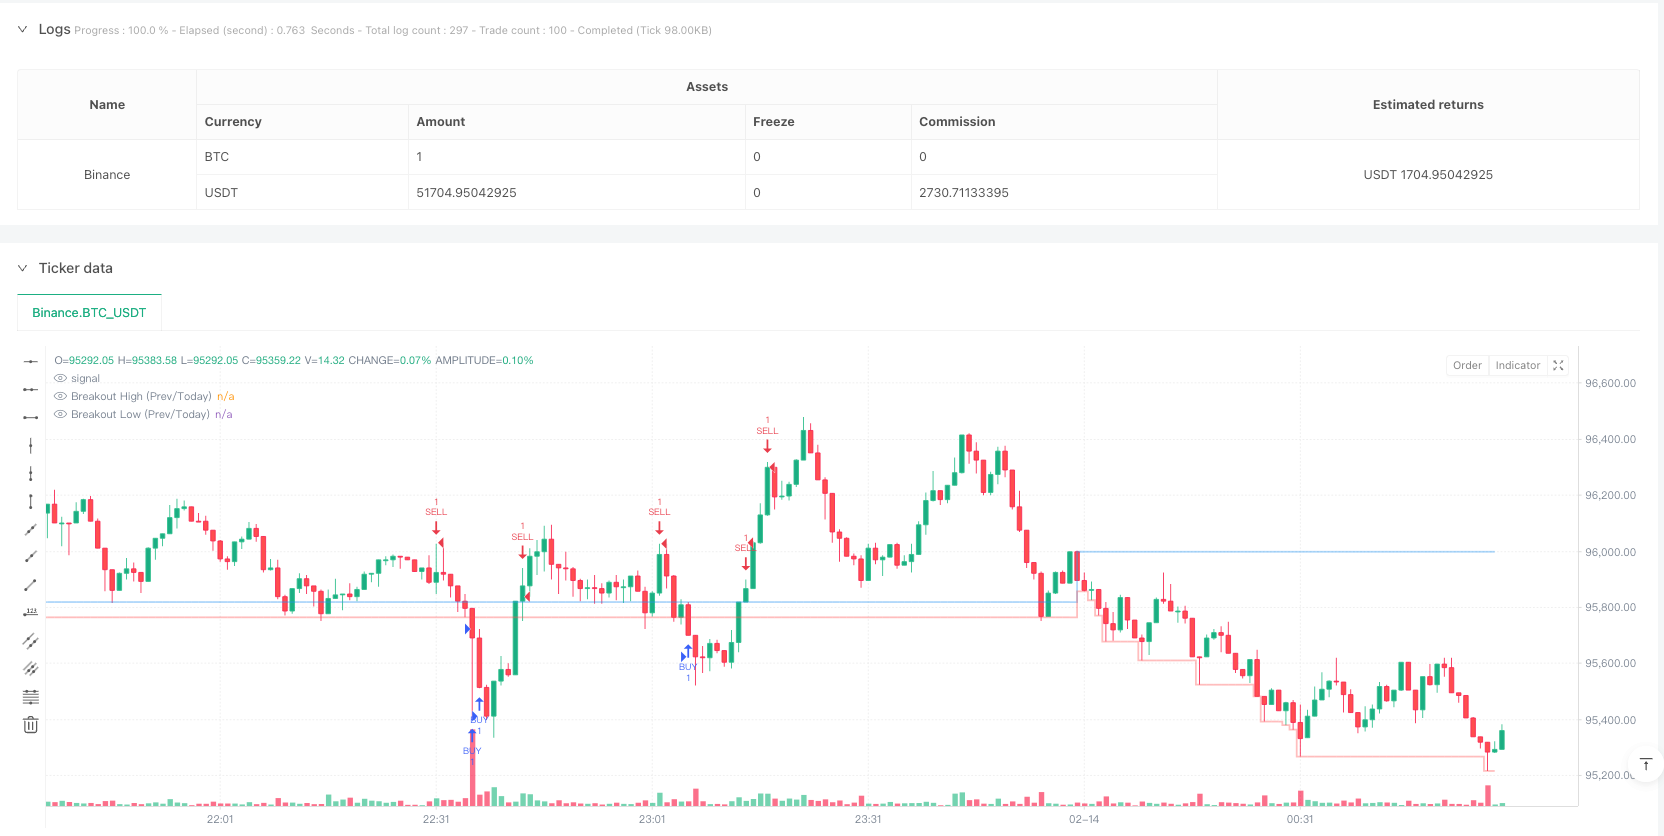
The core logic is based on trading price breakouts of previous high-low points. Specifically: 1. Records previous day’s high and low at the start of each trading day 2. Tracks current day’s high and low in real-time 3. Compares extremes from previous and current day to select reference points 4. Triggers trading signals when price breaks these reference points (considering buffer) 5. Uses 1.5x ATR for stop-loss distance and 2x for profit target 6. Automatically plots breakout positions and provides trading alerts
Strategy Advantages
- Strong Dynamic Adaptability - Dynamically adjusts stop-loss and profit targets through ATR
- Comprehensive Risk Control - Sets ATR-based stop-loss and profit targets for controlled risk
- Signal Filtering Mechanism - Uses buffer to reduce false breakout signals
- Visualization Support - Clearly marks breakout positions on charts for real-time monitoring
- High Automation Level - Includes complete entry and exit logic for automated trading
Strategy Risks
- Sideways Market Risk - May generate frequent false signals in low volatility markets
- Gap Risk - Overnight gaps may render stop-losses ineffective
- Trend Continuation Risk - Fixed ATR multipliers may exit too early in strong trends
- Parameter Sensitivity - Buffer and ATR multiplier settings significantly impact performance
- Market Environment Dependency - Strategy performs better in high volatility markets
Strategy Optimization Directions
- Introduce Trend Filters - Add trend indicators like moving averages for directional trading
- Dynamic Buffer - Automatically adjust buffer size based on market volatility
- Improve Profit Taking - Consider trailing stops to avoid early exits in strong trends
- Time Filtering - Add trading time filters to avoid low volatility periods
- Volume Confirmation - Add volume confirmation mechanism for more reliable breakouts
Summary
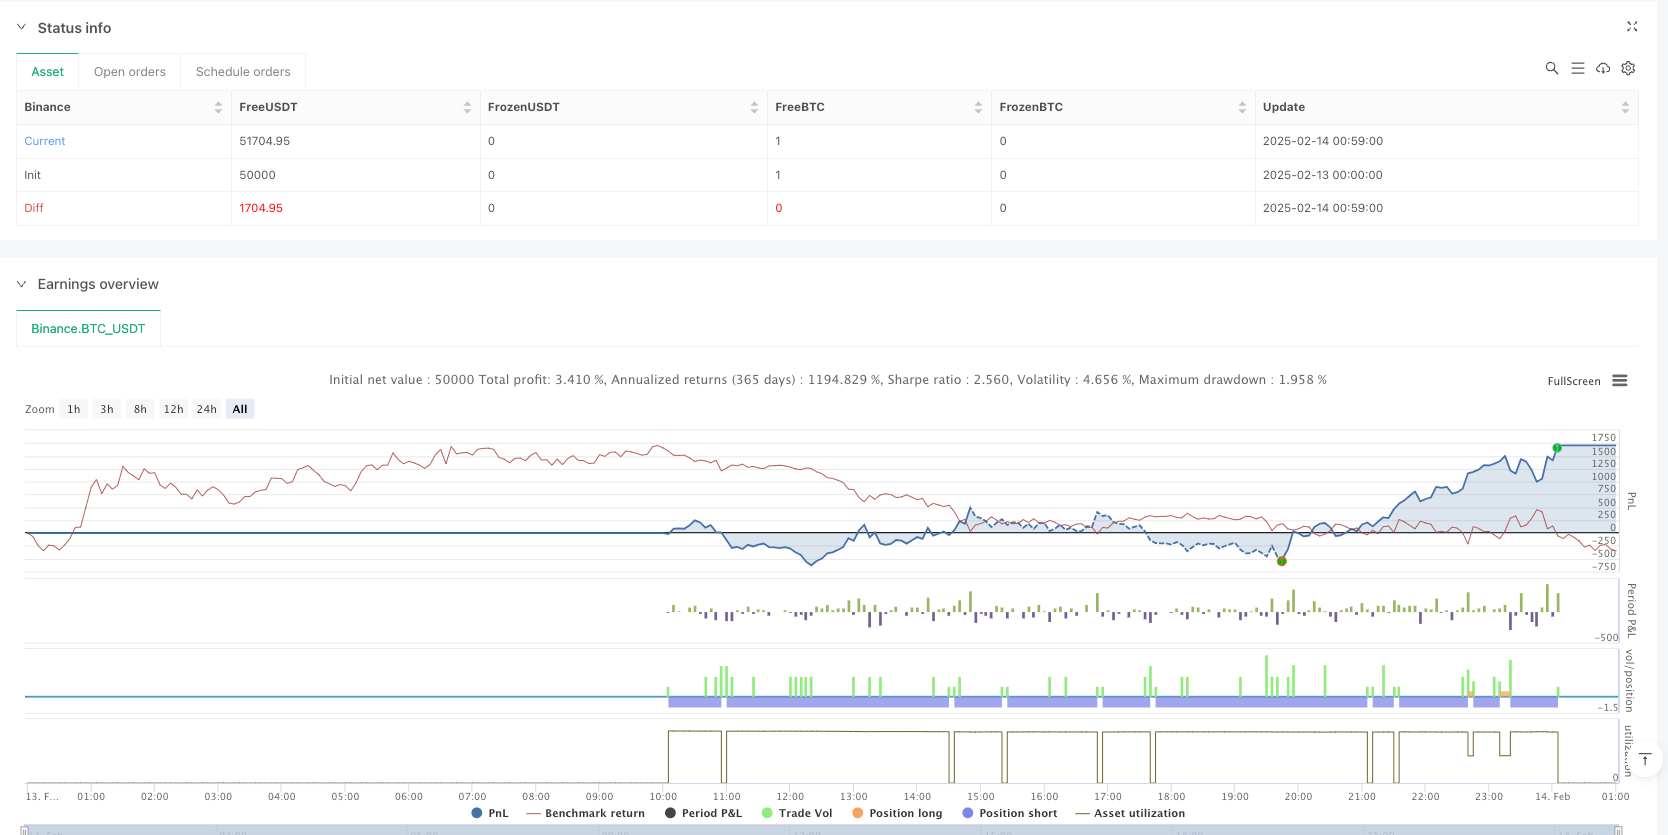
This is a well-designed strategy with clear logic. By combining ATR indicators and buffer concepts, it effectively balances trading opportunities and risk control. The strategy’s visualization and automation levels are high, suitable for intraday traders. However, users need to pay attention to market environment adaptability and adjust parameters based on actual trading results. Through the suggested optimization directions, there is room for further strategy improvement.
/*backtest
start: 2025-02-13 00:00:00
end: 2025-02-14 01:00:00
period: 1m
basePeriod: 1m
exchanges: [{"eid":"Binance","currency":"BTC_USDT"}]
*/

//@version=6
strategy("Previous/Current Day High-Low Breakout Strategy", overlay=true)

// === INPUTS ===
buffer = input(10, title="Buffer Points Above/Below Day High/Low")  // 0-10 point buffer
atrMultiplier = input.float(1.5, title="ATR Multiplier for SL/TP")  // ATR-based SL & TP

// === DETECT A NEW DAY CORRECTLY ===
dayChange = ta.change(time("D")) != 0  // Returns true when a new day starts

// === FETCH PREVIOUS DAY HIGH & LOW CORRECTLY ===
var float prevDayHigh = na
var float prevDayLow = na

if dayChange
    prevDayHigh := high[1]  // Store previous day's high
    prevDayLow := low[1]  // Store previous day's low

// === TRACK CURRENT DAY HIGH & LOW ===
todayHigh = ta.highest(high, ta.barssince(dayChange))  // Highest price so far today
todayLow = ta.lowest(low, ta.barssince(dayChange))  // Lowest price so far today

// === FINAL HIGH/LOW SELECTION (Whichever Happens First) ===
finalHigh = math.max(prevDayHigh, todayHigh)  // Use the highest value
finalLow = math.min(prevDayLow, todayLow)  // Use the lowest value

// === ENTRY CONDITIONS ===
// 🔹 BUY (LONG) Condition: Closes below final low - buffer
longCondition = close <= (finalLow - buffer)

// 🔻 SELL (SHORT) Condition: Closes above final high + buffer
shortCondition = close >= (finalHigh + buffer)

// === ATR STOP-LOSS & TAKE-PROFIT ===
atr = ta.atr(14)
longSL = close - (atr * atrMultiplier)  // Stop-Loss for Long
longTP = close + (atr * atrMultiplier * 2)  // Take-Profit for Long
shortSL = close + (atr * atrMultiplier)  // Stop-Loss for Short
shortTP = close - (atr * atrMultiplier * 2)  // Take-Profit for Short

// === EXECUTE LONG (BUY) TRADE ===
if longCondition
    strategy.entry("BUY", strategy.long, comment="🔹 BUY Signal")
    strategy.exit("SELL TP", from_entry="BUY", stop=longSL, limit=longTP)

// === EXECUTE SHORT (SELL) TRADE ===
if shortCondition
    strategy.entry("SELL", strategy.short, comment="🔻 SELL Signal")
    strategy.exit("BUY TP", from_entry="SELL", stop=shortSL, limit=shortTP)

// === PLOT LINES FOR VISUALIZATION ===
plot(finalHigh, title="Breakout High (Prev/Today)", color=color.new(color.blue, 60), linewidth=2, style=plot.style_stepline)
plot(finalLow, title="Breakout Low (Prev/Today)", color=color.new(color.red, 60), linewidth=2, style=plot.style_stepline)

// === ALERT CONDITIONS ===
alertcondition(longCondition, title="🔔 Buy Signal", message="BUY triggered 🚀")
alertcondition(shortCondition, title="🔔 Sell Signal", message="SELL triggered 📉")