Dual Momentum Trend Reversal Strategy Based on RSI and Stochastic RSI

Overview
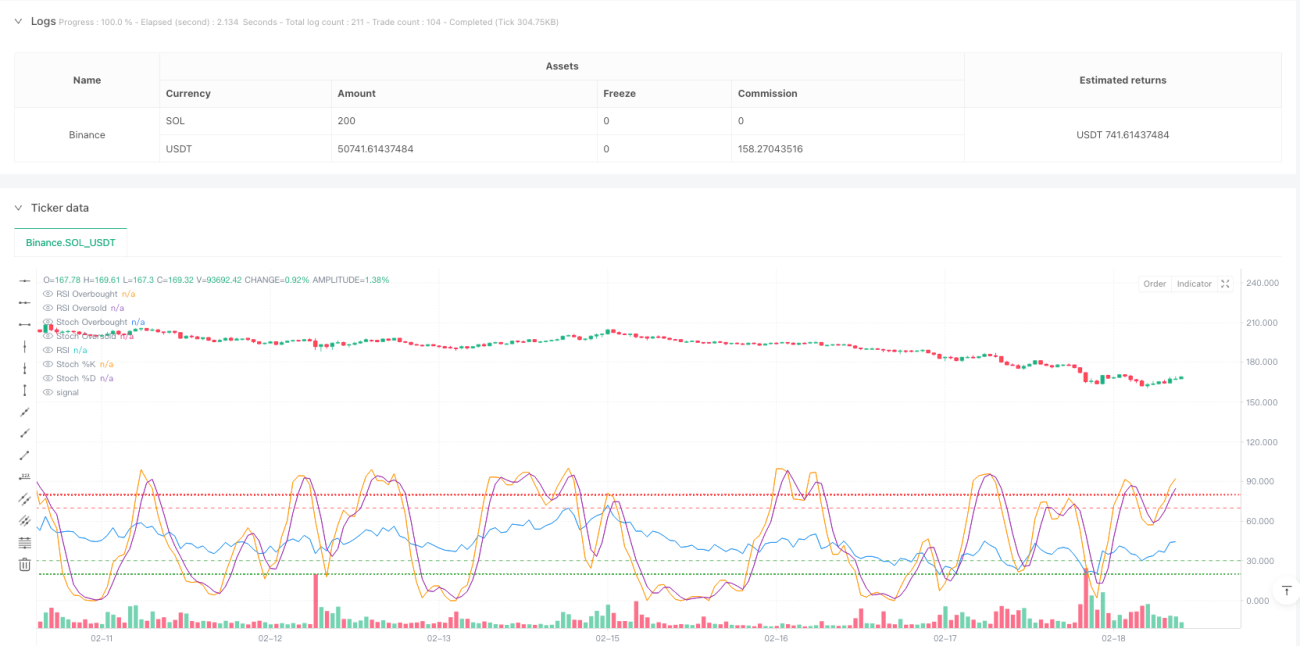
This is a trend reversal trading strategy that combines the Relative Strength Index (RSI) and Stochastic RSI indicators. The strategy aims to capture potential reversal points by identifying overbought and oversold conditions along with momentum shifts in the market. The core concept involves using RSI as the base momentum indicator and calculating Stochastic RSI to further confirm momentum direction changes.
Strategy Principles
The main logic includes the following key steps:
- Calculate RSI values based on closing prices to determine overall overbought/oversold conditions
- Compute Stochastic RSI's %K and %D lines using RSI values as the base
- Generate long entry signals when RSI is in oversold territory (default below 30) and Stochastic RSI's %K line crosses above %D line
- Generate short entry signals when RSI is in overbought territory (default above 70) and Stochastic RSI's %K line crosses below %D line
- Exit positions when opposite RSI conditions occur or when Stochastic RSI shows reverse crossovers
Strategy Advantages
- Dual Confirmation Mechanism - The combination of RSI and Stochastic RSI effectively reduces false breakout risks
- Customizable Parameters - Key parameters like RSI period and overbought/oversold thresholds can be adjusted for different market conditions
- Dynamic Visualization - The strategy provides real-time charts of RSI and Stochastic RSI for monitoring
- Integrated Risk Management - Includes comprehensive stop-loss and profit-taking mechanisms
- High Adaptability - Applicable to different timeframes and market environments
Strategy Risks
- Sideways Market Risk - May generate frequent false signals in range-bound markets
- Lag Risk - Multiple moving average smoothing may cause some delay in signal generation
- Parameter Sensitivity - Different parameter settings may lead to significantly different trading results
- Market Environment Dependency - May miss some opportunities in strong trend markets
- Money Management Risk - Requires proper position sizing for risk control
Strategy Optimization Directions
- Add Trend Filter - Incorporate long-term moving averages as trend filters to trade only in trend direction
- Optimize Stop Loss - Implement dynamic stop-loss mechanisms like trailing stops or ATR-based stops
- Incorporate Volume Indicators - Combine volume analysis to improve signal reliability
- Add Time Filters - Avoid important news release times or low liquidity periods
- Develop Adaptive Parameters - Automatically adjust strategy parameters based on market volatility
Summary
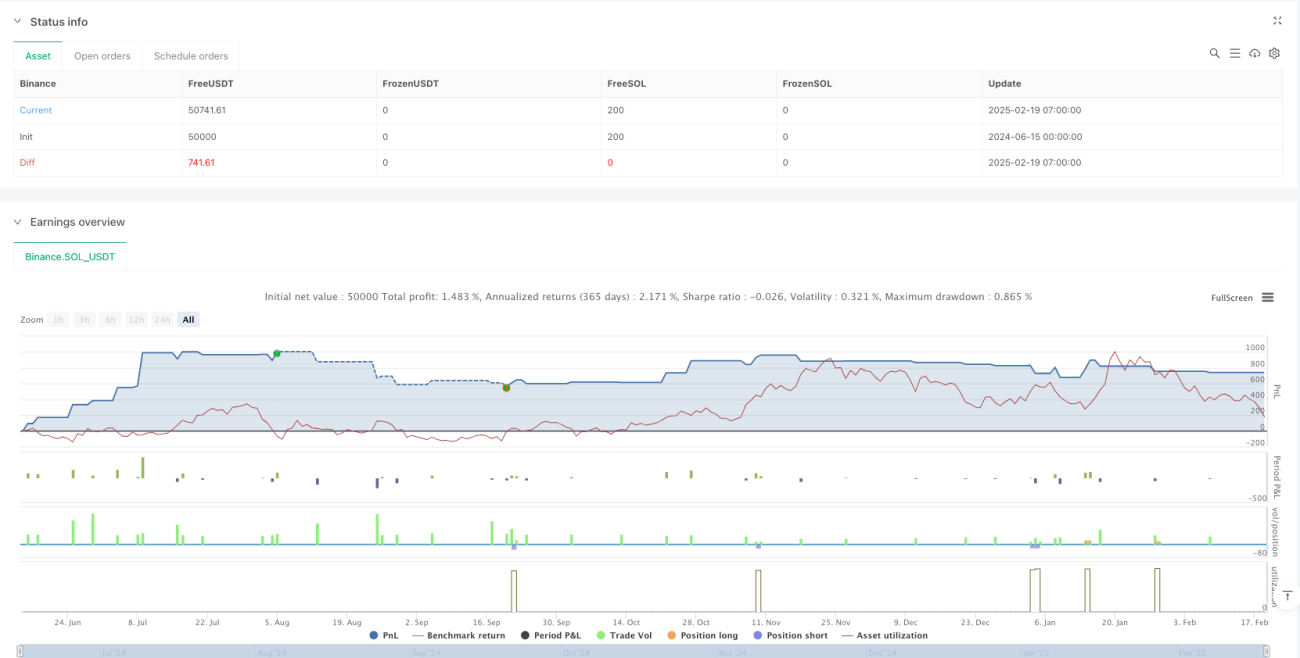
This is a comprehensive strategy combining momentum and trend reversal concepts, using the synergy between RSI and Stochastic RSI to identify potential trading opportunities. The strategy is well-designed with good adjustability and adaptability. However, careful attention must be paid to market environment selection and risk control in practical applications, and thorough backtesting and parameter optimization are recommended before live trading.
/*backtest
start: 2024-06-15 00:00:00
end: 2025-02-19 08:00:00
period: 1h
basePeriod: 1h
exchanges: [{"eid":"Binance","currency":"SOL_USDT"}]
*/

//@version=5
strategy("RSI + Stochastic RSI Strategy", overlay=true, initial_capital=100000, default_qty_type=strategy.percent_of_equity, default_qty_value=10)

// INPUTS- 1