
Overview
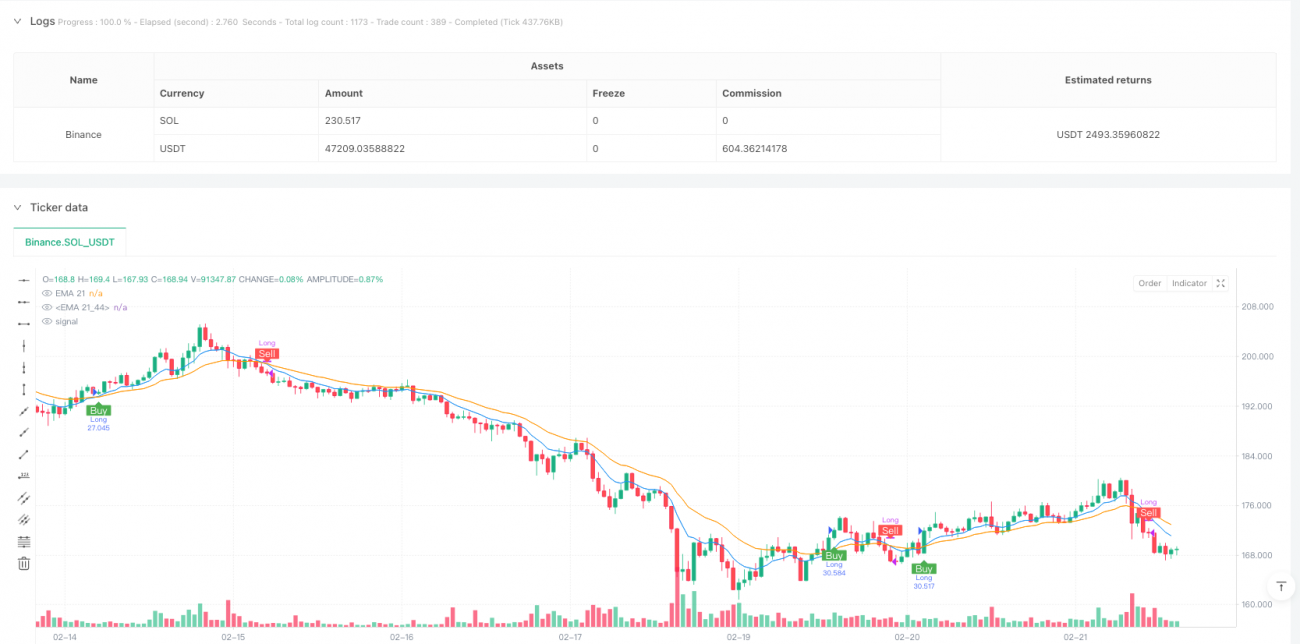
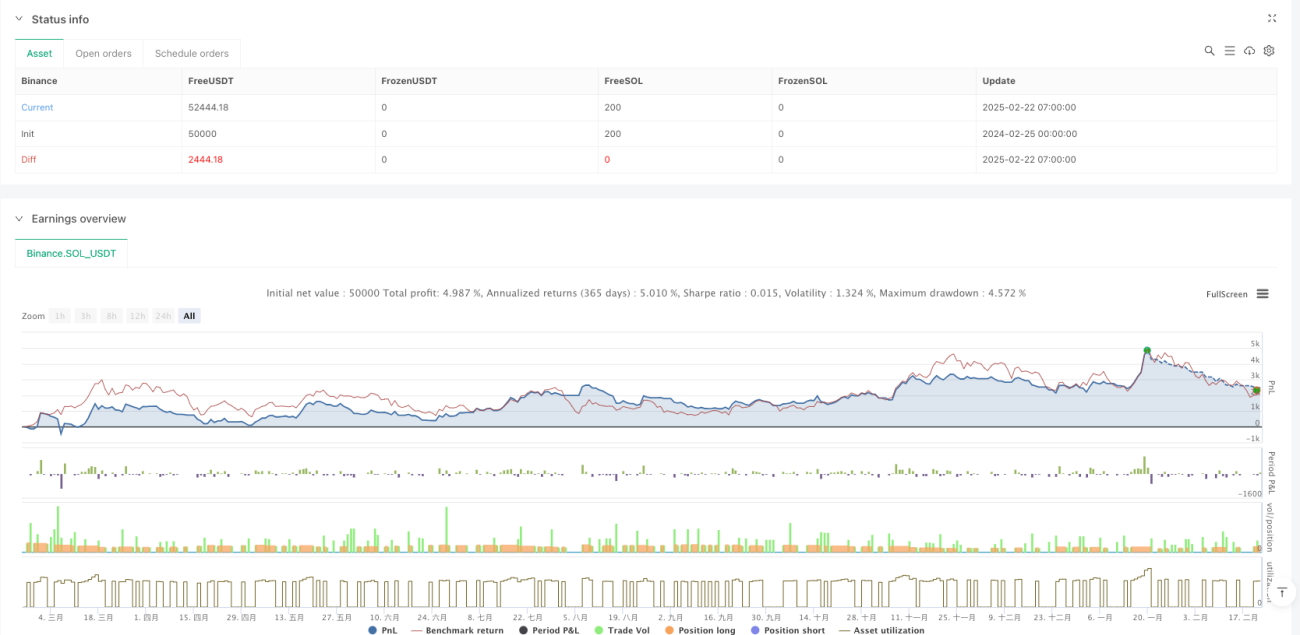
This strategy is a trading system based on dual moving average crossover, monitoring the crossing of 9-period and 21-period Exponential Moving Averages (EMA) for trade execution. The strategy operates on a 10-minute timeframe with a single trade mode, preventing multiple position entries while holding a position. The system utilizes an initial capital of 100,000 and trades with 10% of account equity per transaction.
Strategy Principle
The core principle leverages the characteristic that shorter-period EMAs are more sensitive to price changes than longer-period EMAs. When the short-period EMA (9-period) crosses above the long-period EMA (21-period), indicating strengthening upward momentum, the system generates a long signal. When the short-period EMA crosses below the long-period EMA, indicating strengthening downward momentum, the system generates a position closure signal. The strategy uses the position_size parameter to ensure only one trade at a time, effectively controlling risk.
Strategy Advantages
- Signal Clarity: Using EMA crossovers as trading signals provides objective and clear criteria, avoiding subjective interference.
- Risk Control: Single trade mode prevents risk accumulation from multiple position entries.
- Money Management: Position sizing based on account equity percentage dynamically adjusts trade size with account performance.
- Visual Support: System provides trade signal labels and moving average trend charts for intuitive judgment.
- Real-time Alerts: Integrated trade signal notification ensures traders don't miss important opportunities.
Strategy Risks
- Choppy Market Risk: Frequent EMA crossovers in sideways markets may lead to multiple false breakouts.
- Lag Risk: EMAs are inherently lagging indicators, potentially missing optimal entry points in fast-moving markets.
- Single Dimension: Relying solely on moving average crossovers may ignore other important market information.
- Fixed Timeframe Risk: 10-minute timeframe may not be suitable for all market conditions.
Strategy Optimization Directions
- Multi-dimensional Verification: Recommend adding volume, volatility, and other auxiliary indicators to improve signal reliability.
- Dynamic Parameters: EMA periods could be set as dynamic parameters, adapting to market volatility conditions.
- Position Management: Introduce more sophisticated position management systems, such as volatility-based dynamic adjustment.
- Market Environment Recognition: Add market condition identification module to adopt different trading parameters under various market conditions.
- Stop Loss Optimization: Incorporate dynamic stop-loss mechanisms to enhance risk control flexibility.
Summary
This is a well-designed moving average crossover strategy with clear logic. It captures market trends through EMA crossovers, combined with single trade mode and percentage-based position management to achieve a balance between risk and return. While there are some inherent limitations, the strategy's stability and adaptability can be further enhanced through the suggested optimization directions. In practical application, traders should make appropriate adjustments based on specific market characteristics and individual risk preferences.
/*backtest
start: 2024-02-25 00:00:00
end: 2025-02-22 08:00:00
period: 1h
basePeriod: 1h
exchanges: [{"eid":"Binance","currency":"SOL_USDT"}]
*/

//@version=6
strategy("EMA Crossover Labels (One Trade at a Time)", overlay=true, initial_capital=100000, default_qty_type=strategy.percent_of_equity, default_qty_value=10)

// ==== User Inputs ====- 1