Multi-Dimensional Technical Indicator Fusion Trend Breakthrough Strategy

Overview
This strategy is a trend breakthrough trading system that combines multiple technical indicators and chart patterns. It captures market trend turning points by identifying key patterns (such as double tops/bottoms, head and shoulders) and price breakouts, while incorporating technical indicators like EMA, ATR, and volume for signal filtering and risk management, achieving efficient trend following and risk control.
Strategy Principles
The core logic consists of three main components:
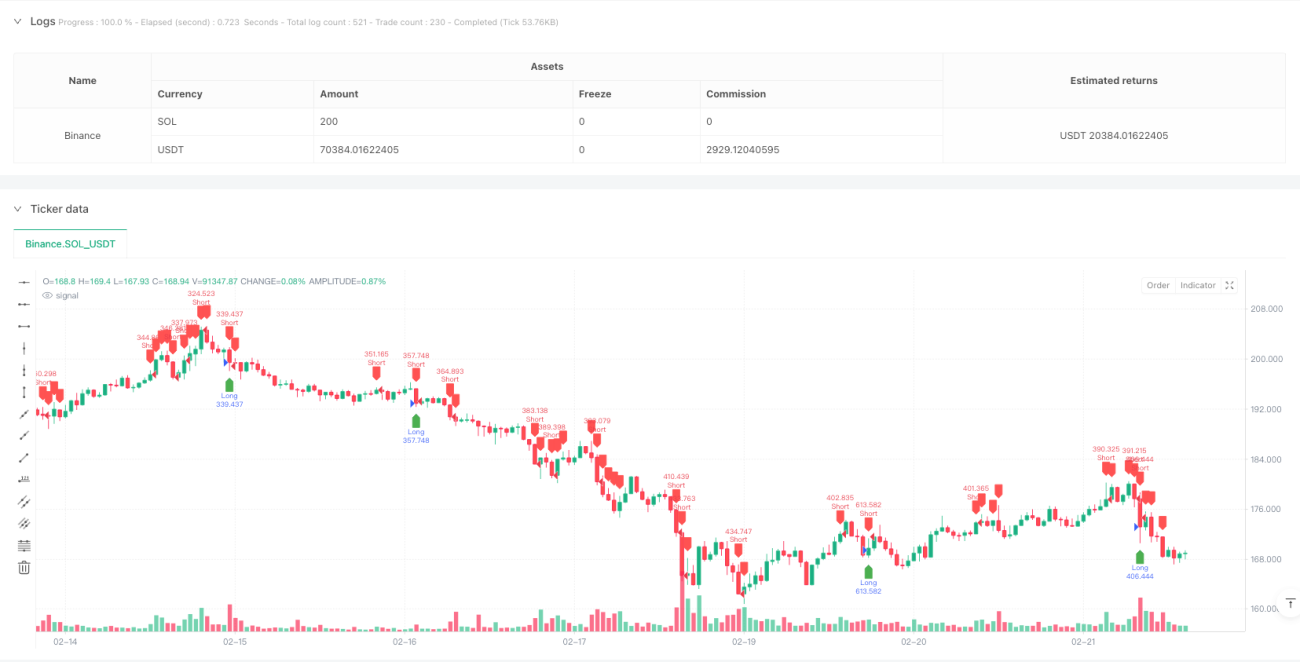
- Pattern Recognition: Uses sliding window method to identify classic technical patterns like double tops/bottoms and head and shoulders, confirming trend reversal signals through comparison of highs/lows and EMA crossovers.
- Trend Confirmation System: Uses 50-period EMA as trend filter, combines price breakouts to confirm trend direction, validates signals through volume filter (requiring volume above 120% of 20-day average).
- Risk Management System: Dynamically sets take-profit and stop-loss based on 14-period ATR, precisely controls risk-reward ratio through 1.5x ATR multiplier.
Strategy Advantages
- Multi-dimensional Signal Fusion: Combines market information from multiple dimensions including chart patterns, moving averages, volatility, and volume, improving signal reliability.
- Dynamic Risk Management: Uses ATR to dynamically adjust take-profit and stop-loss positions, adapting to different market environments.
- High Automation: System automatically identifies patterns, generates trading signals, and executes orders, reducing manual intervention.
- Clear Visualization: Intuitively displays trading signals through graphical markers and alert system.
Strategy Risks
- False Breakout Risk: False breakout signals may occur in oscillating markets, requiring strict volume confirmation.
- Lag Risk: Indicators like moving averages and ATR have inherent lag, potentially missing optimal entry points.
- Parameter Sensitivity: Strategy performance heavily depends on parameter settings, requiring backtest optimization.
- Market Environment Dependency: Strategy may underperform in sideways markets with unclear trends.
Optimization Directions
- Introduce Market Environment Recognition: Add trend strength indicators (like ADX) to distinguish between trending and oscillating markets, dynamically adjust strategy parameters.
- Optimize Signal Filtering: Consider adding oscillating indicators like RSI to further filter false breakout signals.
- Enhance Risk Control: Introduce position management system to dynamically adjust position size based on market volatility.
- Improve Adaptability: Develop adaptive parameter system to automatically optimize strategy parameters based on market conditions.
Summary
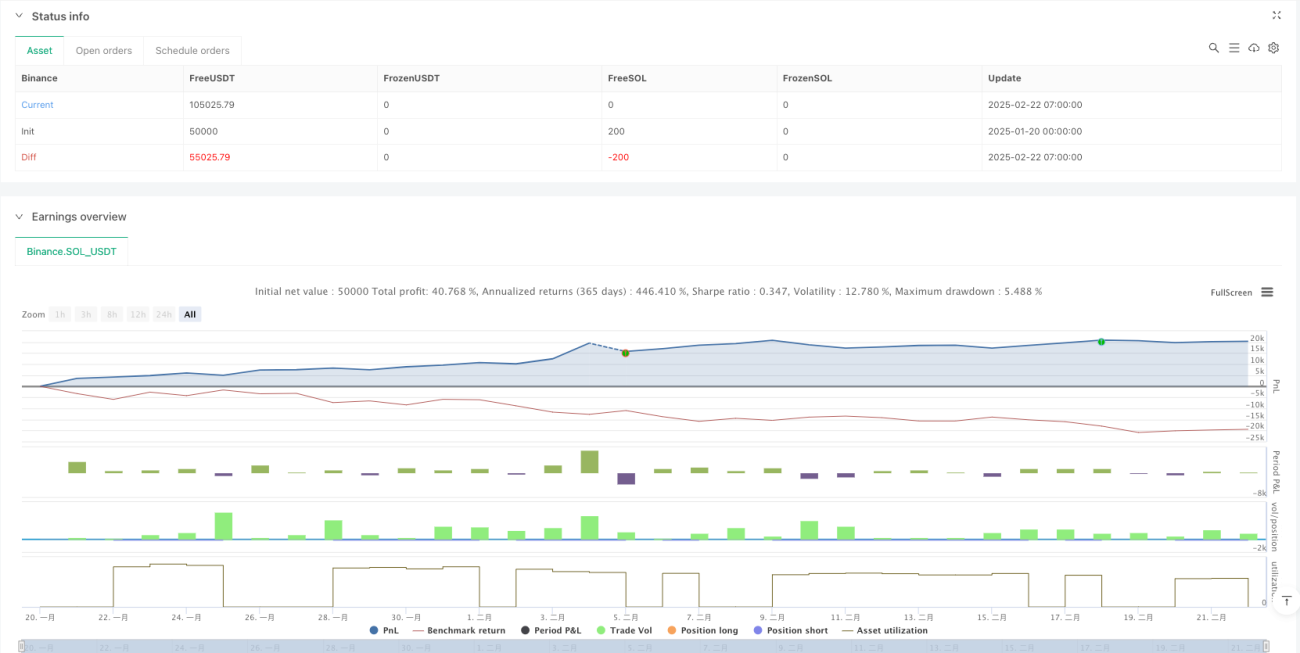
This strategy effectively captures market trend turning points through the fusion application of multi-dimensional technical indicators. The system design comprehensively considers key elements such as signal generation, trend confirmation, and risk control, demonstrating strong practicality. Through the suggested optimization directions, the strategy's stability and adaptability can be further enhanced. In live trading, traders are advised to adjust strategy parameters based on specific market characteristics and individual risk preferences.
/*backtest
start: 2025-01-20 00:00:00
end: 2025-02-22 08:00:00
period: 1h
basePeriod: 1h
exchanges: [{"eid":"Binance","currency":"SOL_USDT"}]
*/

//@version=5
strategy("Ultimate Pattern Finder", overlay=true, default_qty_type=strategy.percent_of_equity, default_qty_value=100)

// 🎯 CONFIGURABLE PARAMETERS- 1