Dynamic Dual EMA Trend Following Strategy

Overview
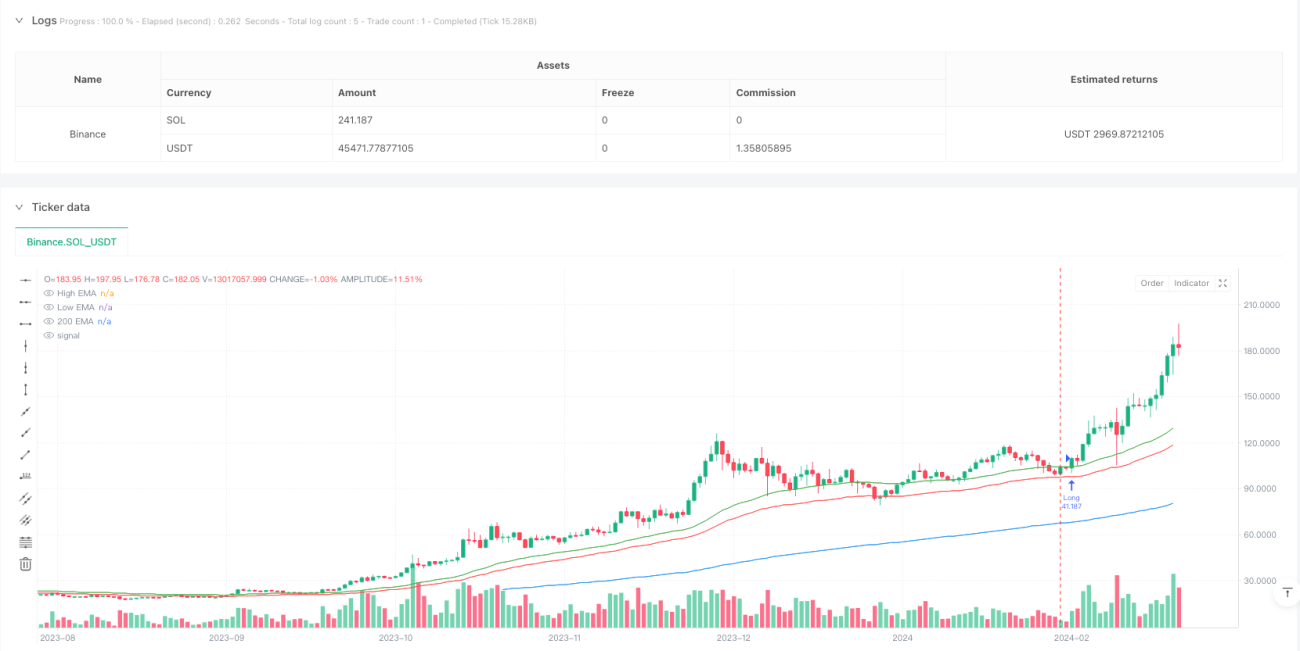
This strategy is a trend following trading system based on dual Exponential Moving Averages (EMA). It utilizes 44-period and 200-period EMAs, combined with price breakout signals to determine trading direction. The system integrates risk management mechanisms, including dynamic position sizing and trailing stop-loss.
Strategy Principle
The core logic is based on price interaction with dual EMAs. The 44-period EMA is applied to both high and low prices to form a channel, while the 200-period EMA serves as a long-term trend filter. Long signals are generated when the closing price breaks above the upper EMA and satisfies the 200 EMA filter condition; short signals are generated when the closing price breaks below the lower EMA and meets the 200 EMA filter condition. The strategy employs dynamic position sizing based on account equity, automatically calculating position size according to risk percentage per trade. Stop-loss levels are set at respective EMA positions.
Strategy Advantages
- Clear trend following logic with reliable trend confirmation through dual EMA channel and long-term moving average filter
- Flexible trade direction options, allowing long-only, short-only, or bidirectional trading
- Comprehensive risk control mechanisms including dynamic position sizing and trailing stops
- Highly adjustable parameters for optimization in different market environments
- Simple and efficient calculations suitable for real-time trading execution
Strategy Risks
- EMA indicators have inherent lag, potentially generating delayed signals in volatile markets
- Range-bound markets may produce frequent false breakout signals
- Stop-loss placement may be too wide during quick reversals, leading to larger drawdowns
- Position sizing depends on price volatility, potentially generating oversized positions in highly volatile environments
Strategy Optimization Directions
- Add volume confirmation indicators to improve breakout signal reliability
- Implement volatility adaptive mechanisms for dynamic EMA parameter adjustment
- Optimize stop-loss mechanism, consider introducing ATR-based dynamic stops
- Add profit target management with dynamic trailing take-profit
- Incorporate market environment filters to identify unsuitable trading conditions
Summary
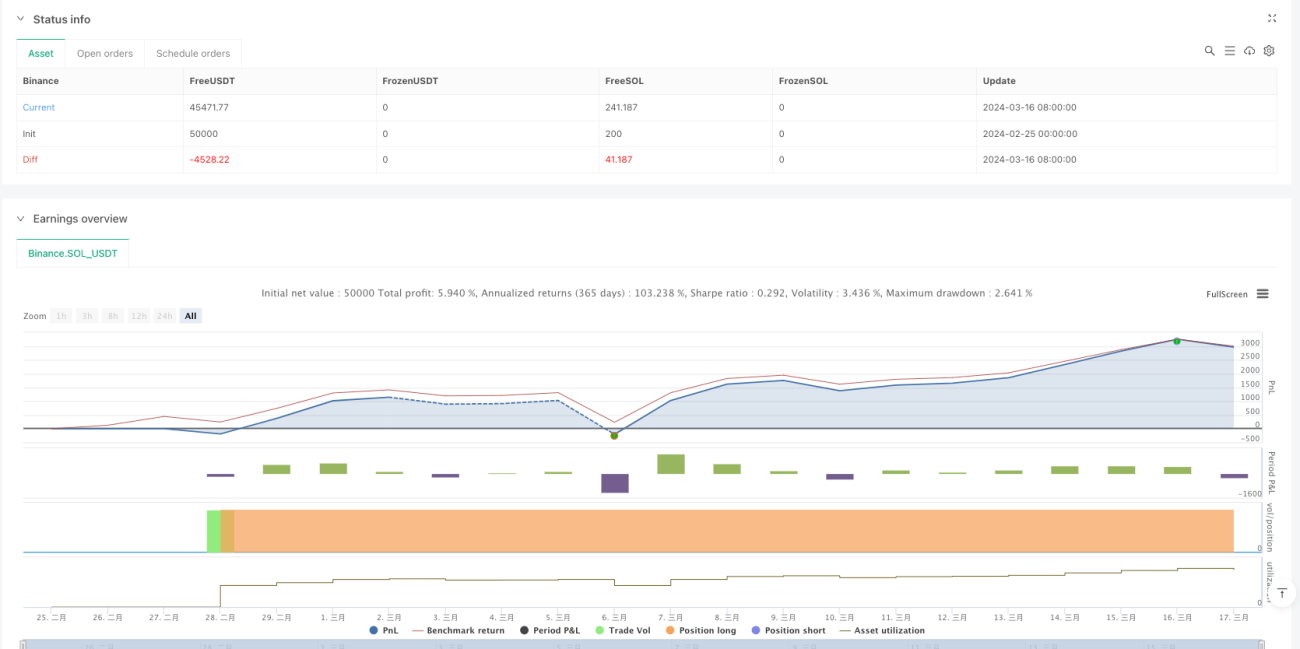
This is a well-structured trend following strategy with clear logic. It provides trading signals through dual EMA channels and long-term trend filtering, coupled with comprehensive risk management mechanisms, demonstrating good practicality. Strategy optimization opportunities mainly lie in signal confirmation, dynamic parameter adjustment, and risk management mechanism enhancement. In practical application, it is recommended to thoroughly test parameter sensitivity and optimize specifically based on the characteristics of the traded instrument.
- 1