EMA-MACD Trend Reversal Quantitative Trading Strategy

Overview
This strategy is a trend reversal trading system based on moving averages and MACD indicators. It combines Fast Exponential Moving Average (EMA), Simple Moving Average (SMA), and MACD indicator to capture profit opportunities during market trend changes. The strategy focuses on price breakouts above moving averages and MACD bottom reversal signals below the zero line to position trades before potential market reversals.
Strategy Principle
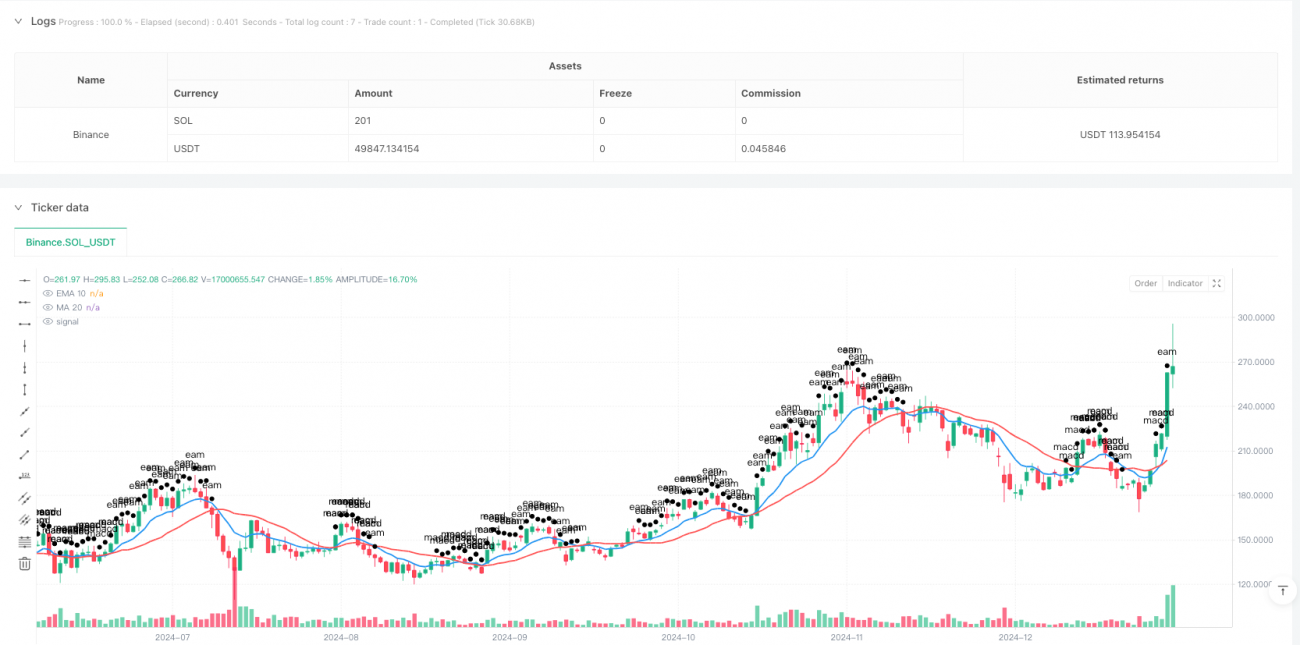
The strategy uses EMA(10) and MA(20) as trend judgment benchmarks, combined with MACD indicator (12,26,9) for signal confirmation. Specifically, entry signals require the following conditions to be met simultaneously:
- EMA(10) crosses above MA(20), indicating short-term momentum is becoming stronger than medium-term trend
- Both MACD and signal lines are below the zero line, but MACD line is above the signal line, showing potential bottom reversal signals
The exit condition is triggered when the MACD delta crosses below 0 while both MACD and signal lines are above the zero line, suggesting the uptrend may have ended.
Strategy Advantages
- Multiple technical indicators cross-validation improves signal reliability
- Combines trend and momentum indicators for both trend capture and precise entry timing
- Uses both EMA and SMA to balance market sensitivity and false signal filtering
- Clear exit conditions help secure profits and avoid being trapped
Strategy Risks
- May generate frequent false breakout signals in ranging markets
- Moving average system has inherent lag, potentially missing optimal entry points
- MACD indicator may generate lagging signals in volatile markets
- Lacks explicit stop-loss mechanism, potentially leading to significant losses in volatile markets
Strategy Optimization Directions
- Introduce volatility indicators (like ATR) for dynamic position sizing and stop-loss placement
- Add trend strength filters to avoid trading in weak trends
- Optimize moving average parameters based on different market characteristics
- Add volume indicator verification to improve signal reliability
- Build a more comprehensive money management system, including staged position building and dynamic position adjustment
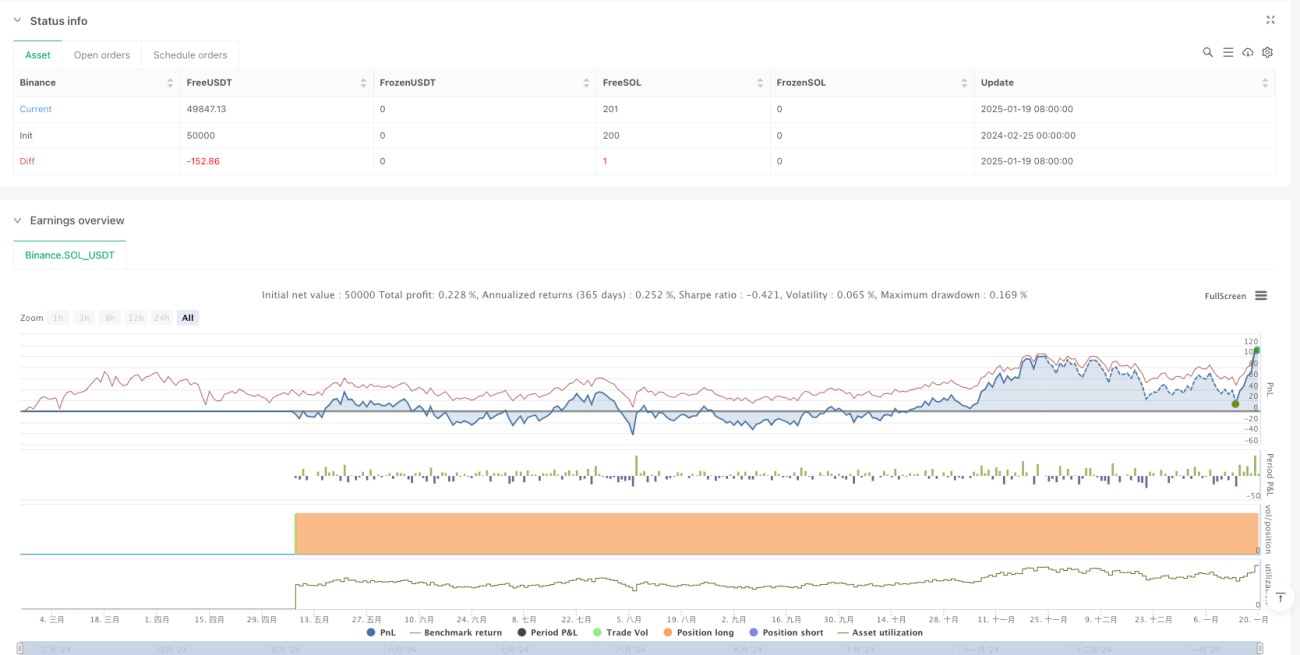
Summary
This strategy constructs a relatively complete trend reversal trading system through the combination of moving average system and MACD indicator. Although it has certain inherent lag and false signal risks, it still holds practical value through reasonable parameter optimization and risk control measures. When implementing in live trading, it's recommended to adjust strategy parameters based on market conditions and personal risk preference.
- 1