Multi-Indicator Trend Momentum Trading Strategy with Dynamic Risk Management System

EMA RSI MACD ATR SMA
Created on: 2025-02-24 09:50:52 Modified on: 2025-02-24 09:50:52
Copy: 0 Number of hits: 447
avatar of ianzeng123 ianzeng123
2
Follow
319
Followers

 Multi-Indicator Trend Momentum Trading Strategy with Dynamic Risk Management System  Multi-Indicator Trend Momentum Trading Strategy with Dynamic Risk Management System

Overview

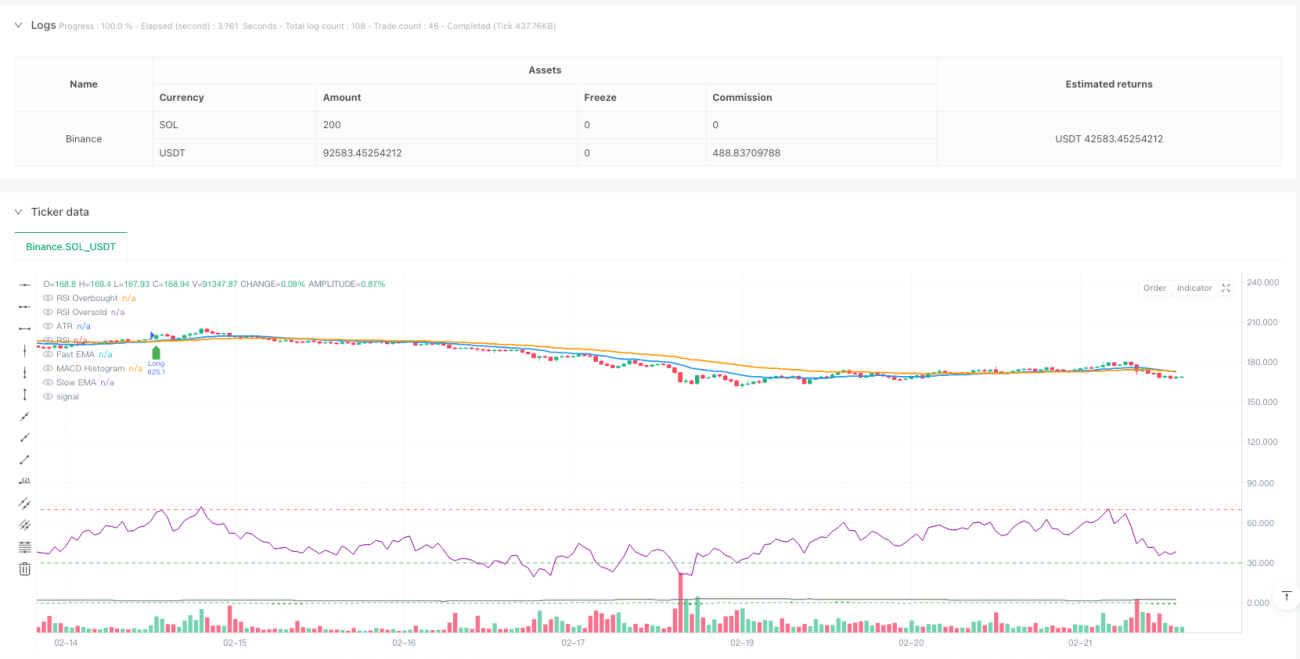
This strategy is a comprehensive trend-following trading system that combines multiple technical indicators to identify market trends and momentum while incorporating a dynamic risk management mechanism. The strategy confirms trading signals through the coordination of moving average crossovers, Relative Strength Index (RSI), and Moving Average Convergence Divergence (MACD), while using the Average True Range (ATR) to dynamically adjust stop-loss positions for adaptive risk management.

Strategy Principles

The core logic is built on cross-validation of multiple technical indicators. First, it identifies potential trend turning points through the crossover of fast exponential moving average (EMA20) and slow exponential moving average (EMA50). Second, it uses the RSI indicator to confirm whether prices are in overbought or oversold zones, avoiding counter-trend trading in extreme areas. Third, it incorporates MACD as a momentum confirmation tool, validating trend momentum through histogram polarity. Finally, it integrates an ATR-based dynamic stop-loss system that automatically adjusts stop distances based on market volatility. The strategy also includes an optional volume filter to confirm adequate market participation.

Strategy Advantages

  1. Multi-dimensional signal confirmation mechanism significantly reduces false breakout risks and improves signal reliability.
  2. Dynamic risk management system automatically adjusts stop-loss positions based on market volatility, avoiding issues associated with fixed stops.
  3. Money management system automatically calculates position sizes based on account equity, ensuring consistent risk exposure.
  4. Strategy demonstrates good adaptability, applicable to different timeframes and market conditions.
  5. Volume filter design helps identify strong market movements with institutional participation.

Strategy Risks

  1. In highly volatile market conditions, the lag of multiple indicators may delay entry signals.
  2. Excessive indicator filtering might miss potential opportunities, reducing strategy win rate.
  3. Moving average crossovers may generate frequent false signals in ranging markets, increasing trading costs.
  4. ATR stops might lead to larger drawdowns during sudden volatility expansions.
  5. Reliance on volume indicators may generate misleading signals in markets with poor liquidity.

Strategy Optimization Directions

  1. Introduction of adaptive parameter mechanisms to dynamically adjust indicator parameters based on different market conditions.
  2. Addition of trend strength filters to reduce trading frequency in weak trend environments.
  3. Optimization of stop-loss mechanisms by incorporating support and resistance levels for smarter stop placement.
  4. Integration of volatility prediction models to adjust risk management parameters proactively.
  5. Development of more sophisticated volume analysis models to improve market participation judgment accuracy.

Summary

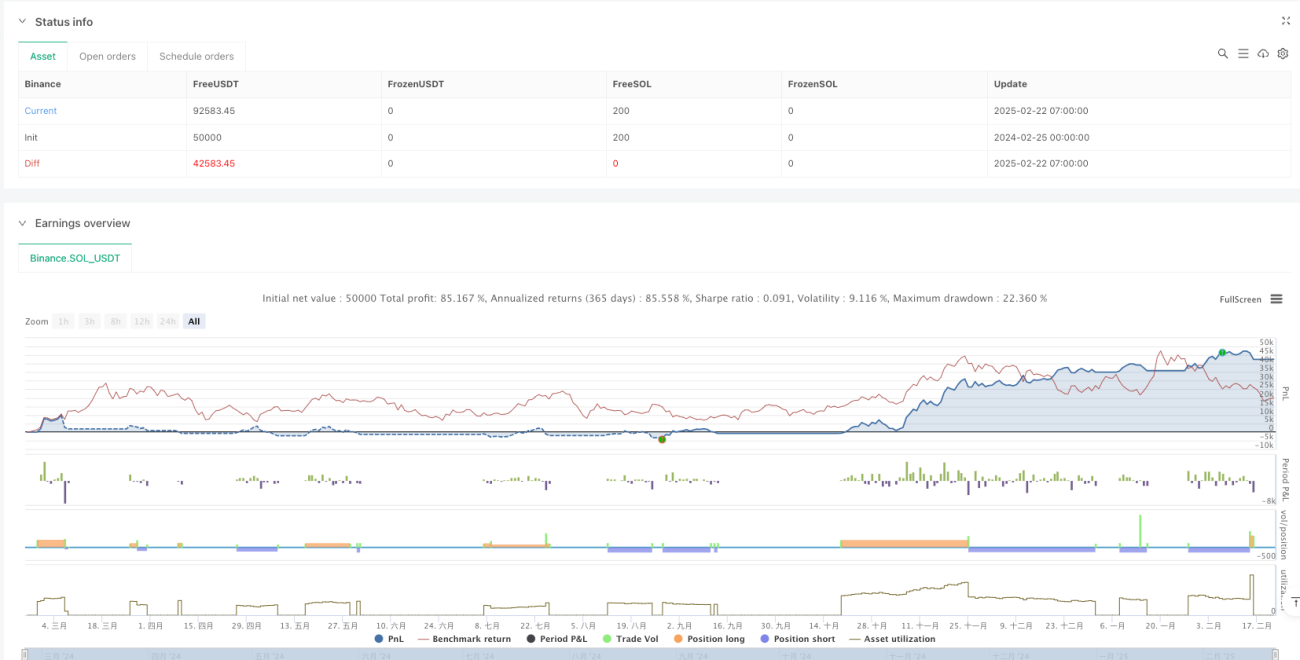
This is a well-designed trend-following strategy that enhances trading signal reliability through the synergy of multiple technical indicators and features a professional risk management system. The strategy offers strong scalability, suitable for both intraday trading and longer-term trend capture. Through the suggested optimization directions, there is room for further improvement. Before live implementation, it is recommended to thoroughly validate parameter settings in a backtesting environment and make targeted adjustments based on specific market characteristics.

Strategy source code
/*backtest
start: 2024-02-25 00:00:00
end: 2025-02-22 08:00:00
period: 1h
basePeriod: 1h
exchanges: [{"eid":"Binance","currency":"SOL_USDT"}]
*/

// This Pine Script™ code is subject to the terms of the Mozilla Public License 2.0 at https://mozilla.org/MPL/2.0/
// © blockchaindomain719

//@version=6
strategy("The Money Printer v2", overlay=true, default_qty_type=strategy.percent_of_equity, default_qty_value=5)

// === INPUTS ===
ema1_length = input(20, "Fast EMA")
ema2_length = input(50, "Slow EMA")

rsi_length = input(14, "RSI Length")
rsi_overbought = input(70, "RSI Overbought")
rsi_oversold = input(30, "RSI Oversold")

macd_fast = input(12, "MACD Fast")
macd_slow = input(26, "MACD Slow")
macd_signal = input(9, "MACD Signal")

atr_length = input(14, "ATR Length")
atr_mult = input(2.5, "ATR Multiplier for Stop-Loss")
trailing_mult = input(3.5, "Trailing Stop Multiplier")

use_volume = input(true, "Use Volume Filter?")
volume_mult = input(2.0, "Min Volume Multiplier")

capital_risk = input(2.0, "Risk Per Trade (%)") / 100

// === CALCULATE INDICATORS ===
ema1 = ta.ema(close, ema1_length)
ema2 = ta.ema(close, ema2_length)

rsi = ta.rsi(close, rsi_length)
macd_line = ta.ema(close, macd_fast) - ta.ema(close, macd_slow)
macd_signal_line = ta.ema(macd_line, macd_signal)
macd_hist = macd_line - macd_signal_line

atr = ta.atr(atr_length)

volume_filter = not na(volume) and volume > ta.sma(volume, 20) * volume_mult

// === ENTRY CONDITIONS ===
longEntry = ta.crossover(ema1, ema2) and rsi > rsi_oversold and macd_hist > 0 and (not use_volume or volume_filter)
shortEntry = ta.crossunder(ema1, ema2) and rsi < rsi_overbought and macd_hist < 0 and (not use_volume or volume_filter)

// === DYNAMIC RISK MANAGEMENT ===
capital = strategy.equity
risk_amount = capital * capital_risk
trade_size = risk_amount / math.max(atr * atr_mult, 1)


// Stop-Loss & Trailing Stop Calculation
longSL = close - (atr * atr_mult)
shortSL = close + (atr * atr_mult)

longTS = close - (atr * trailing_mult)
shortTS = close + (atr * trailing_mult)

// === EXECUTE TRADES ===
if longEntry
    strategy.entry("Long", strategy.long, qty=trade_size)
    strategy.exit("Trailing Stop", from_entry="Long", stop=longTS)

if shortEntry
    strategy.entry("Short", strategy.short, qty=trade_size)
    strategy.exit("Trailing Stop", from_entry="Short", stop=shortTS)

// === ALERTS ===
alertcondition(longEntry, title="BUY Signal", message="💎 Money Printer Bot: Buy Now!")
alertcondition(shortEntry, title="SELL Signal", message="🔥 Money Printer Bot: Sell Now!")

// === PLOTTING INDICATORS ===
plot(ema1, title="Fast EMA", color=color.blue, linewidth=2)
plot(ema2, title="Slow EMA", color=color.orange, linewidth=2)

// RSI Indicator
hline(rsi_overbought, "RSI Overbought", color=color.red)
hline(rsi_oversold, "RSI Oversold", color=color.green)
plot(rsi, title="RSI", color=color.purple)

// MACD Histogram
plot(macd_hist, title="MACD Histogram", color=color.green, style=plot.style_columns)

// ATR Visualization
plot(atr, title="ATR", color=color.gray)

// Buy & Sell Markers
plotshape(series=longEntry, location=location.belowbar, color=color.green, style=shape.labelup, title="BUY")
plotshape(series=shortEntry, location=location.abovebar, color=color.red, style=shape.labeldown, title="SELL")