
Overview
This strategy is a quantitative trading system based on 24-hour trading volume, price highs and lows, and Fibonacci retracement levels. The strategy determines trading opportunities by combining crossover signals from short-term and long-term moving averages while using volume and Fibonacci levels to validate price trend validity. This multi-dimensional indicator combination can both capture market trends and execute trades at key support and resistance levels.
Strategy Principles
The core logic of the strategy includes the following key elements:
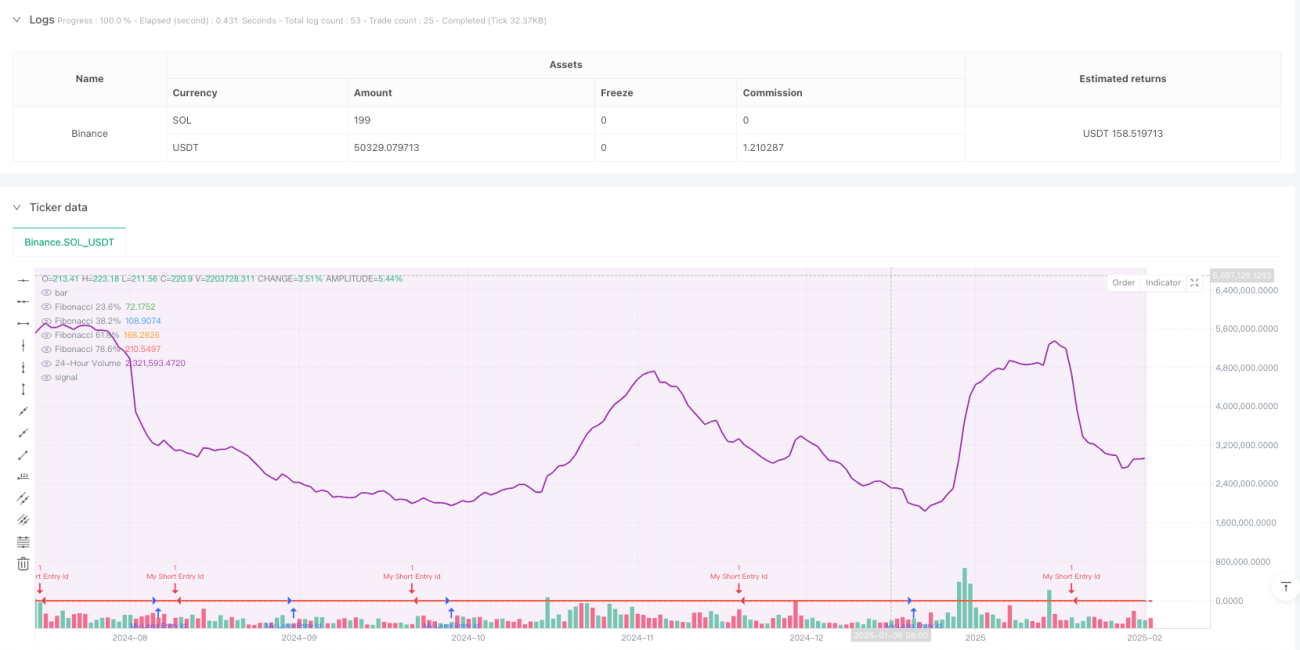
- 24-Hour Price Range Tracking: The system continuously monitors and updates the highest and lowest prices within each trading day to establish the price fluctuation range.
- Fibonacci Retracement Calculation: Calculates four key Fibonacci retracement levels (23.6%, 38.2%, 61.8%, and 78.6%) based on intraday highs and lows.
- Volume Analysis: Uses a 20-period Simple Moving Average (SMA) to smooth volume data and reflect market activity.
- Moving Average Crossover Signals: Generates trading signals through crossovers of 14-period and 28-period moving averages, where crossing above indicates a long signal and crossing below indicates a short signal.
Strategy Advantages
- Multi-dimensional Analysis: Combines price, volume, and technical indicators for a more comprehensive market perspective.
- Strong Adaptability: Fibonacci levels are calculated based on real-time price ranges, allowing dynamic adaptation to market changes.
- Reasonable Risk Control: Multiple indicator confirmation reduces risks from false breakouts.
- Clear Operational Logic: Entry signals are explicit, making execution and backtesting straightforward.
- Optimized Time Period: 24-hour monitoring suits markets that trade around the clock.
Strategy Risks
- Choppy Market Risk: Moving average crossover signals may generate frequent trades in sideways markets.
- Lag Issues: Moving average indicators have inherent lag, potentially missing optimal entry points.
- False Breakout Risk: Price breakouts during low liquidity periods may lack genuine volume support.
- Computational Complexity: Real-time calculation of multiple indicators may increase system load.
Strategy Optimization Directions
- Dynamic Parameter Optimization:
- Automatically adjust moving average periods based on market volatility
- Optimize volume moving average period to improve sensitivity to market activity
- Signal Filter Enhancement:
- Add trend strength confirmation indicators
- Introduce volatility filters to avoid trading in low volatility environments
- Risk Management Improvement:
- Implement dynamic stop-loss mechanisms
- Add position sizing algorithms
Summary
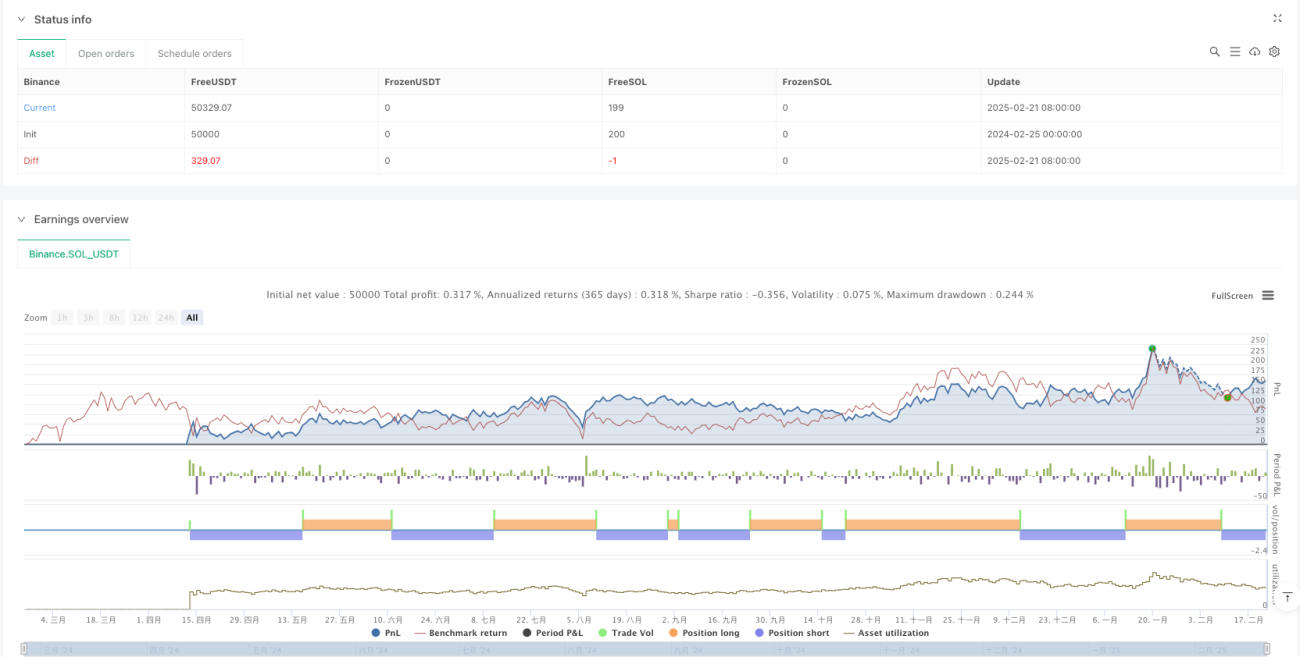
The strategy constructs a logically complete trading system by comprehensively utilizing 24-hour price ranges, Fibonacci retracement levels, volume, and moving average crossovers. The strategy's main advantages lie in its multi-dimensional analysis and adaptability, but attention must be paid to risks such as choppy markets and false breakouts. Through the suggested optimization directions, the strategy's stability and profitability potential can be further enhanced.
- 1