Counter-Trend Breakout Trading System: A Quantitative Strategy Based on Multi-Day Price Patterns and Volatility Filtering

Overview
The Counter-Trend Breakout Trading System is a long-only strategy designed for daily charts that cleverly combines price action pattern recognition with volatility filtering mechanisms. Its core concept is to seek potential reversal opportunities after consecutive market declines, while ensuring sufficient market momentum through volatility conditions. The strategy employs a "contrarian thinking" approach to trading, entering the market during periods of weakness, but only executing when volatility is sufficiently high, and exiting either on reversal signals or after a preset holding period.
Strategy Principles
The Counter-Trend Breakout Trading System operates based on the following key principles:
-
Entry Conditions:
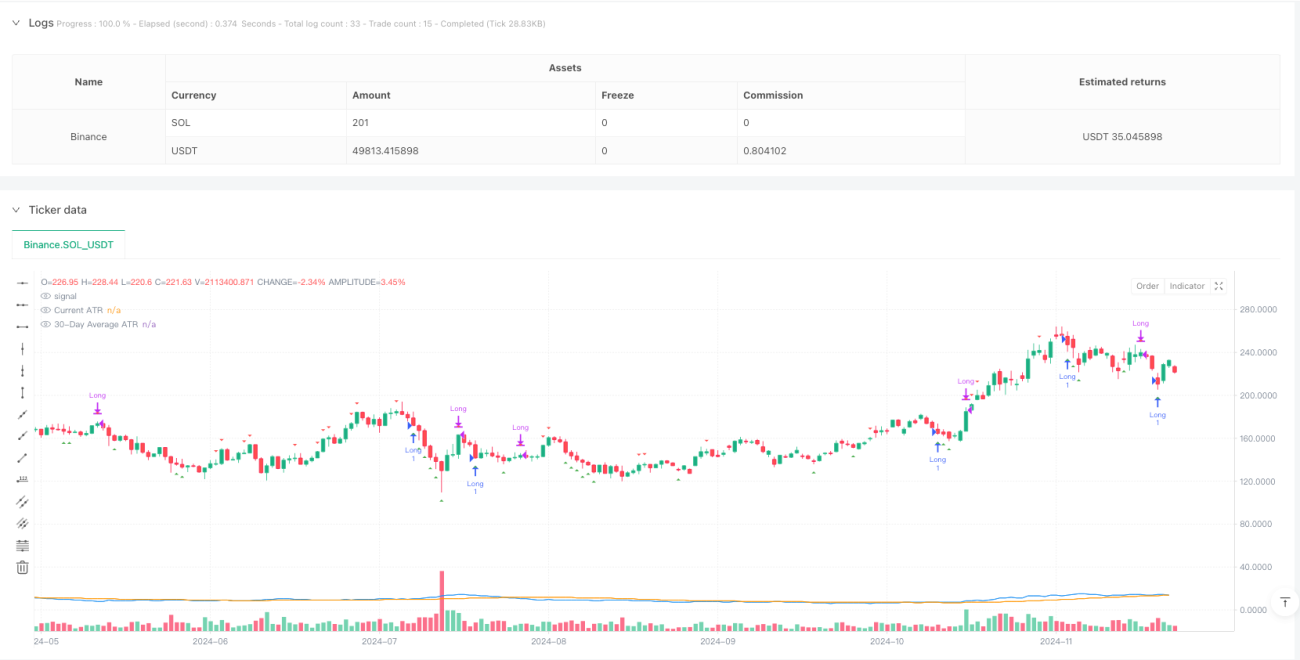
- Price Action Trigger: When the market shows 3 consecutive red bars (daily closing prices below opening prices), the system identifies a potential oversold condition and prepares to enter a long position.
- Volatility Filter: Entry is only permitted when the current ATR (Average True Range, default period of 12) is greater than its 30-day simple moving average. This ensures the market has sufficient volatility to support the trade.
-
Exit Conditions:
- Reversal Signal: When 3 consecutive green bars occur (daily closing prices above opening prices), the system considers the uptrend potentially over and exits the position.
- Time Limit: Regardless of market conditions, any position held for the maximum trade duration (default 22 days) is forcibly closed. This helps limit risk exposure during stagnant or unfavorable market conditions.
- Optional Exit Condition: The strategy allows traders to choose whether to enable the "3 green bars" exit condition, enabling the use of only time-based exits if preferred.
-
Parameter Settings:
- Maximum Trade Duration (days): Default is 22 days.
- ATR Period: Default is 12 days.
- Use 3 Green Bars Exit: Can be toggled to enable or disable this exit condition.
The code implements precise trading logic, including recording the entry bar index to calculate trade duration and resetting relevant variables after trade completion. Additionally, the strategy provides visualization elements, such as graphical markers for entry and exit signals, as well as curves for current ATR and its 30-day average, allowing traders to conduct intuitive analysis.
Strategy Advantages
After in-depth code analysis, this strategy demonstrates the following significant advantages:
-
Contrarian Logic: The strategy adopts contrarian thinking, entering the market after consecutive declines, which aligns with the classic trading wisdom of "buying during panic," helping to capture oversold rebound opportunities.
-
Volatility Filter: By requiring the current ATR to be greater than its 30-day moving average, the strategy ensures trades only occur when the market has sufficient volatility, avoiding entry during low-volatility consolidation markets.
-
Clear Exit Mechanisms: The strategy provides two exit mechanisms—signal-based exits and time-based exits—allowing traders to flexibly manage risk and prevent trades from stagnating for extended periods.
-
Parameter Customizability: Key parameters such as maximum trade duration, ATR period, and exit conditions can be adjusted according to different markets and trader preferences.
-
Built-in Risk Management: The maximum trade duration setting forcibly limits the risk exposure time of any single trade, even if the market doesn't provide a clear exit signal.
-
Visual Confirmation Tools: The strategy includes graphical markers for entry/exit signals and visualization of the ATR indicator, making it easier for traders to monitor strategy execution.
-
Simple yet Effective: Despite its conceptual simplicity, the strategy combines price action and volatility analysis to enhance the quality of trading decisions, avoiding the lag and parameter over-fitting issues that can come with complex indicators.
Strategy Risks
Despite the strategy's rational design, the following potential risks were identified after analyzing the code:
-
False Breakout Risk: Three consecutive down days doesn't necessarily mean a reversal is imminent; the market may continue its downward trend, resulting in suboptimal entry points.
- Solution: Consider adding additional confirmation indicators, such as Relative Strength Index (RSI) or stochastic indicators to confirm oversold conditions.
-
Volatility Risk: High volatility may indicate market instability, which while providing trading opportunities, also increases the risk of sharp price fluctuations.
- Solution: Implement stricter stop-loss mechanisms, or adjust volatility filter parameters to balance opportunity and risk.
-
Blind Time-based Exits: Exits based on fixed days don't consider current market conditions, potentially leading to premature exits during favorable trends or late exits during unfavorable trends.
- Solution: Consider combining trailing stops or price-level-based exit conditions for more flexible exits.
-
Parameter Sensitivity: Strategy performance may be highly sensitive to parameter choices such as ATR period and maximum trade duration.
- Solution: Conduct thorough parameter optimization and backtesting to find robust parameter combinations suitable for specific market conditions.
-
Lack of Stop-Loss Mechanism: The current strategy doesn't implement a traditional stop-loss function, which may lead to excessive losses during dramatic market fluctuations.
- Solution: Add stop-loss mechanisms based on fixed percentages or ATR multiples.
-
Market Condition Dependency: The strategy may perform well under specific market conditions (such as high-volatility environments) but may be less effective in other market phases.
- Solution: Develop market state filters to activate trading only under market conditions suitable for this strategy.
Strategy Optimization Directions
Based on code analysis, here are potential optimization directions for this strategy:
-
Add Adaptive ATR Filtering: Currently using a fixed 30-day ATR moving average as a volatility reference, consider using an adaptive period that dynamically adjusts the ATR reference period based on market conditions. This can better adapt to different market environments, as ideal ATR reference periods may differ between trending and consolidating markets.
-
Implement Dynamic Maximum Trade Duration: Allow the maximum trade duration to adjust dynamically based on market volatility or trend strength, permitting longer holding times in strong trending markets and shortening holding times in weak trend or consolidation markets.
-
Add Stop-Loss Mechanism: Introduce stop-loss settings based on ATR multiples to limit maximum losses per trade and improve capital management efficiency. For example, setting a stop-loss at the entry price minus 2 times the current ATR value.
-
Incorporate Trend Filters: Add a broader trend filter (such as a longer-period moving average) to ensure trading only occurs in the direction of the major trend, avoiding counter-trend reversal trades during strong overall trends.
-
Optimize Entry Conditions: Consider using more complex price patterns or combining technical indicators (such as RSI, MACD) to confirm entry signals and improve entry quality.
-
Implement Partial Profit Locking: After a trade reaches a certain profit level, implement partial position closing to lock in some profits, while allowing the remaining position to continue capturing potential larger movements.
-
Add Volume Validation: Use volume as an additional condition for signal confirmation, for example, requiring gradually decreasing volume on consecutive down days (weakening seller momentum), which may indicate higher-quality reversal opportunities.
-
Seasonal Adjustments: Analyze the impact of different market seasons (such as months, quarters) on strategy performance, potentially disabling or adjusting strategy parameters during specific periods to address seasonal effects.
Summary
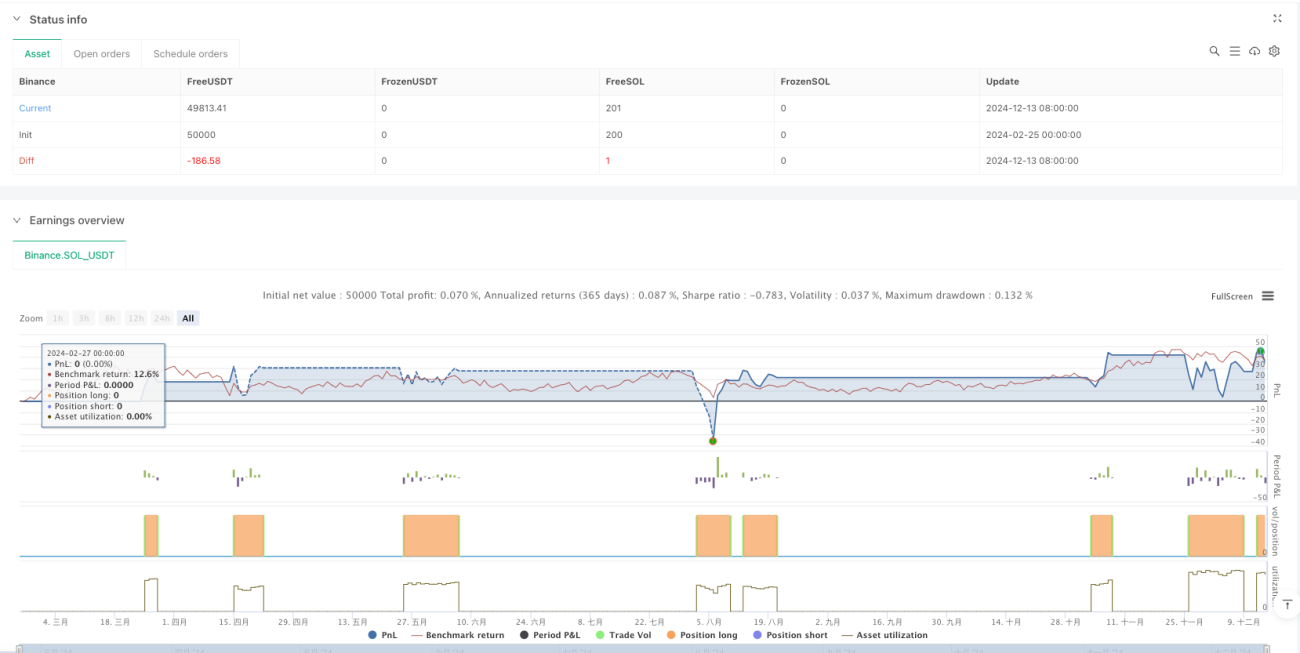
The Counter-Trend Breakout Trading System is a quantitative trading strategy that combines price action patterns and volatility filtering, designed to capture market rebound opportunities after short-term oversold conditions. By requiring three consecutive down days in the market with volatility higher than average as entry conditions, while setting clear signal-based or time-based exit mechanisms, the strategy theoretically balances trading opportunities and risk control.
The main advantages of the strategy lie in its simple and intuitive logic, built-in risk management mechanisms, and customizable parameter settings, making it suitable for various trader preferences and market environments. However, the strategy also faces challenges such as false breakouts, volatility risks, and parameter sensitivity, which need to be managed through adding confirmation indicators, implementing stop-loss mechanisms, and optimizing parameter settings.
Through further optimization—such as adding adaptive ATR filtering, implementing dynamic maximum trade duration, adding stop-loss mechanisms, etc.—the strategy's robustness and adaptability can be enhanced. Most importantly, traders should conduct thorough backtesting and parameter optimization before actual deployment to ensure the strategy's effectiveness under specific market conditions and adjust parameters according to individual risk tolerance and investment objectives.
This strategy provides a valuable quantitative trading framework, combining technical analysis and risk management principles to offer traders a structured approach to capturing market reversal opportunities. It not only demonstrates how to use price action and volatility to design trading systems but also emphasizes the importance of exit strategies and risk control in successful trading.
- 1