
Overview
This strategy is a quantitative trading system designed specifically for intraday trading, with its core concept revolving around price action during the first hour of market trading. The strategy identifies key breakout levels based on the high and low points of the market's first hour, combining EMA (Exponential Moving Average), VWAP (Volume Weighted Average Price), and dynamic ATR (Average True Range) stop-loss mechanisms to build a comprehensive trading system. The strategy particularly emphasizes the selection of entry timing, allowing trade signals to trigger only after the market's first hour has concluded, which helps avoid early market volatility and false breakouts. Additionally, the strategy utilizes the slope of the EMA as a trend confirmation tool, ensuring that the trading direction aligns with the short-term trend, thereby increasing the success rate of trades.
Strategy Principles
The core logic of the strategy can be divided into several key components:
-
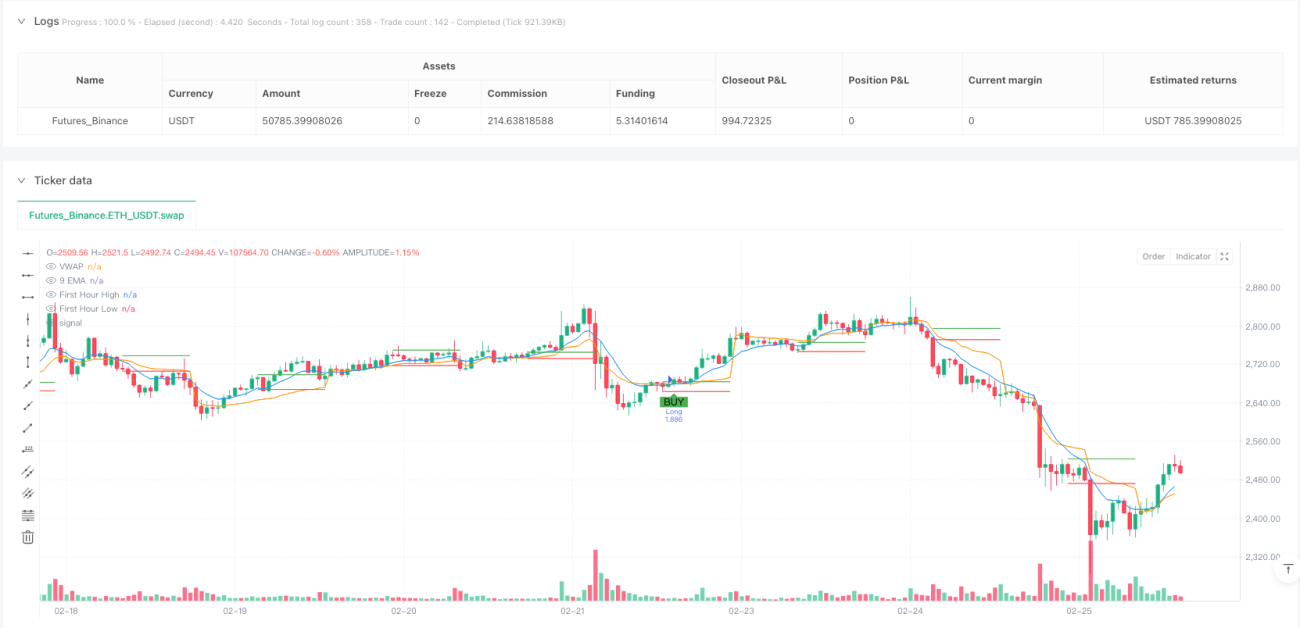
First Hour High/Low Determination: The strategy monitors and records the highest and lowest prices during the first hour of market opening (60 minutes starting from 9:15), which serve as potential breakout points.
-
Technical Indicator Calculations:
- 9-period EMA: Acts as a quick indicator of price trends
- VWAP: Serves as a reference for the overall market price level
- EMA Slope: Calculates the difference between the current EMA and the previous period's EMA to confirm trend direction
-
Entry Conditions:
- Long Entry: Price breaks above the first hour high, while the 9-period EMA crosses above the VWAP, and the EMA slope is positive
- Short Entry: Price breaks below the first hour low, while the 9-period EMA crosses below the VWAP, and the EMA slope is negative
- Both entry conditions require that the first hour time period has ended
-
Exit Strategy:
- Stop-Loss: Dynamic stop-loss based on ATR, defaulted to 1x ATR
- Take-Profit: Fixed percentage target, defaulted to a 1% price movement
-
Money Management:
- The strategy defaults to using 10% of account equity for each trade
This design philosophy combines breakout trading, trend confirmation, and dynamic risk management to form a complete and systematic trading method. By requiring both price breakouts and technical indicator confirmations to occur simultaneously, the strategy effectively reduces the risk of false breakouts.
Strategy Advantages
Through deep analysis of the strategy code, the following distinct advantages can be summarized:
-
Precise Entry Timing: By using the first hour's high and low as key levels, the strategy can capture important intraday breakout opportunities. The market's first hour often sets the trading range for the day, and breakouts from these levels typically indicate strong momentum.
-
Multiple Confirmation Mechanisms: The strategy relies not only on price breakouts but also requires confirmation through EMA and VWAP crossovers as well as EMA slope direction consistency. This multi-layered filtering significantly reduces false signals.
-
Dynamic Risk Management: Using ATR as the basis for stop-losses, the strategy can automatically adjust stop-loss distances according to market volatility, providing more breathing room for prices during high volatility and tightening stops to protect profits during low volatility.
-
Clear Trading Rules: The strategy defines clear entry and exit conditions, reducing subjective judgment and helping maintain trading discipline.
-
Visual Assistance Features: The code includes signal markers and key level visualization, helping traders intuitively understand strategy logic and monitor trading opportunities in real-time.
-
Adaptation to Market Rhythm: By only allowing entries after the first hour has concluded, the strategy avoids the disorderly fluctuations common during market opening, focusing on movements more likely to continue.
Strategy Risks
Despite its well-designed approach, the strategy still presents some potential risks and limitations:
-
Over-reliance on a Single Time Period: The strategy heavily depends on the high and low points formed during the first hour. If this period is not representative (e.g., abnormally low volatility or influenced by temporary news), it may lead to a decline in subsequent signal quality.
-
Limitations of Fixed Take-Profit Percentage: The fixed 1% take-profit target may not adapt well to different market environments and assets with varying volatility. On strong trend days, this might result in too early profit-taking, missing out on greater potential gains.
-
EMA and VWAP Lag Risk: As lagging indicators, EMA and VWAP crossover signals may occur after the price has already broken out significantly, leading to suboptimal entry prices.
-
Lack of Broader Market Context: The strategy does not incorporate broader market environment assessment (such as overall market trends, volatility conditions, or correlation analysis), which may result in subpar performance under certain market conditions.
-
Execution Challenges of Intraday Strategies: As an intraday strategy, it demands high execution efficiency and low slippage, which may present challenges in actual trading.
To mitigate these risks, it is recommended to:
- Incorporate additional technical or fundamental filtering conditions
- Adjust ATR multipliers and take-profit targets based on asset characteristics
- Consider adding time filters to avoid trading during inefficient periods
- Regularly backtest and adjust parameters based on market changes
Strategy Optimization Directions
Based on analysis of the strategy logic and potential risks, here are several optimization directions worth considering:
-
Adaptive Parameter Adjustment:
- Automatically adjust ATR multipliers based on historical volatility
- Dynamically set take-profit targets based on asset characteristics or market conditions
- Consider implementing adaptive EMA periods to suit different market environments
-
Incorporate Market Environment Filtering:
- Include overall market trend assessment, such as index direction
- Add volatility filters to adjust strategy behavior during extremely high or low volatility periods
- Consider time filtering to avoid specific inefficient trading periods
-
Optimize First Hour Logic:
- Test different first hour definitions (e.g., 30 minutes, 45 minutes, or 90 minutes)
- Consider using the price structure of the first hour rather than simple high/low points
- Explore the relationship between the previous trading day's close and the current day's open as additional filtering conditions
-
Improve Exit Mechanisms:
- Implement trailing stops to protect profits while allowing trends to continue
- Test dynamic exits based on technical indicators (such as EMA reverse crossovers)
- Consider partial profit strategies, closing part of the position when specific targets are reached
-
Enhanced Risk Management:
- Adjust position sizes based on daily volatility expectations
- Implement daily loss limits to control overall risk
- Consider adaptive risk management based on past trading results
These optimization directions aim to retain the core logic of the strategy while improving its adaptability and robustness, enabling it to remain effective across a broader range of market conditions.
Summary
The First Hour ATR Stop-Loss with EMA Slope Optimization Strategy is a well-structured intraday quantitative trading system that combines first hour high/low breakouts, technical indicator confirmation, and dynamic risk management to provide traders with a systematic trading method. The strategy's greatest strengths lie in its multiple confirmation mechanisms and clear trading rules, which help reduce false signals and maintain trading discipline.
However, the strategy also has some limitations, such as over-reliance on a single time period and adaptability issues with fixed take-profit targets. By implementing the suggested optimization measures, such as adaptive parameter adjustment, incorporating market environment filtering, and improving exit mechanisms, traders can further enhance the strategy's robustness and adaptability.
Overall, this is a trading strategy with solid foundations and clear thinking, particularly suitable for quantitative traders interested in intraday trading. With appropriate parameter adjustments and optimizations, it has the potential to become an effective tool in a trading portfolio. It's worth noting that any trading strategy requires thorough backtesting and validation, along with proper money management in line with individual risk tolerance.
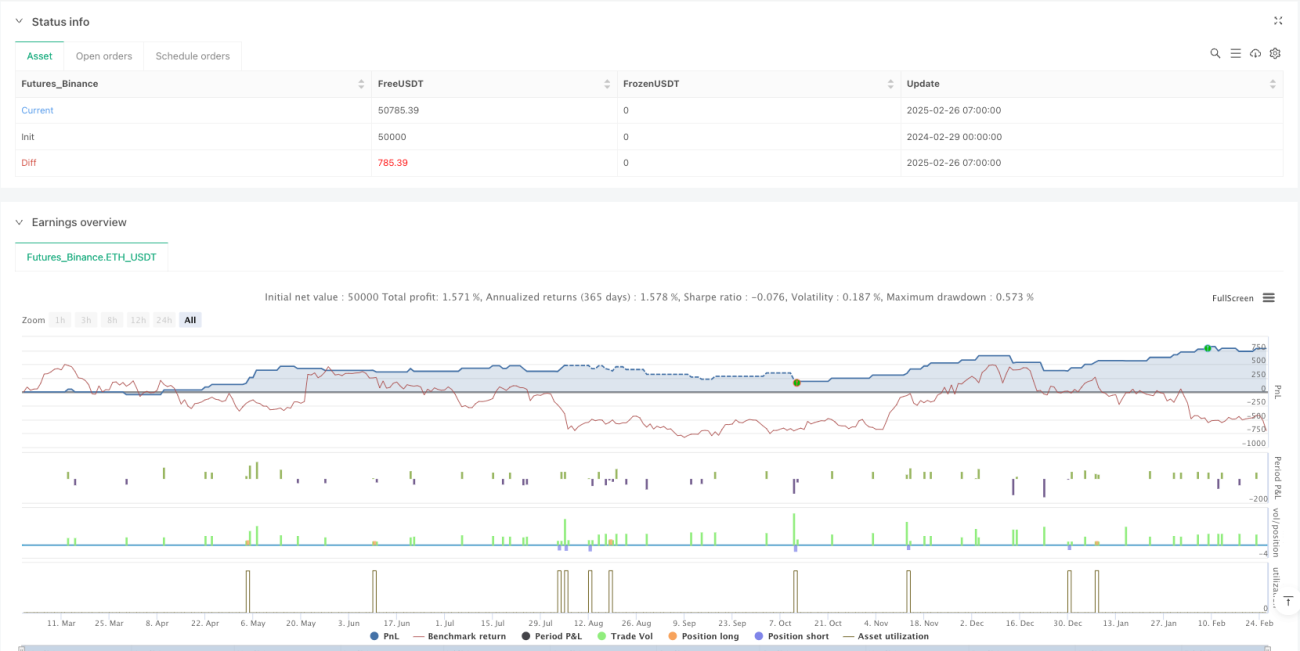
/*backtest
start: 2024-02-29 00:00:00
end: 2025-02-26 08:00:00
period: 1h
basePeriod: 1h
exchanges: [{"eid":"Futures_Binance","currency":"ETH_USDT"}]
*/

//@version=5
strategy("FnO Intraday Strategy with ATR SL, EMA Slope & Signals", overlay=true, initial_capital=100000, default_qty_type=strategy.percent_of_equity, default_qty_value=10)

// INPUTS- 1