Overview
The ATR-Enhanced Candlestick Reversal Pattern Recognition and Risk Management Strategy is a trading system focused on identifying potential market reversal points. This strategy primarily works by detecting two classic candlestick patterns—Hammer (bullish reversal signal) and Shooting Star (bearish reversal signal)—combined with the Average True Range (ATR) indicator as a filtering condition to ensure trade signals are triggered only in environments with significant price volatility. Additionally, the strategy incorporates ATR-based dynamic stop-loss and take-profit mechanisms, effectively controlling the risk-reward ratio for each trade. This strategy is suitable for medium to long-term traders, especially those looking to add a risk management dimension to their technical analysis approach.
Strategy Principles
The core principle of this strategy is based on identifying specific candlestick patterns and validating these patterns through the ATR indicator. The specific implementation logic is as follows:
ATR Filter Setup: The strategy uses a 14-period ATR to calculate market volatility and sets 1.5 times ATR as the threshold for pattern validity, ensuring signals are triggered only in environments with sufficient price movement.
Candlestick Pattern Definitions:
- Calculates candle body size, upper wick, lower wick, and total range
- Hammer definition: Lower wick length exceeds twice the body length, upper wick length is less than body length, and total range is greater than 1.5 times ATR
- Shooting Star definition: Upper wick length exceeds twice the body length, lower wick length is less than body length, and total range is greater than 1.5 times ATR
Signal Confirmation Mechanism:
- Hammer signal confirmation: Pattern meets Hammer definition, and closing price crosses above opening price
- Shooting Star signal confirmation: Pattern meets Shooting Star definition, and closing price crosses below opening price
Entry Conditions:
- When Hammer signal is confirmed, execute long entry
- When Shooting Star signal is confirmed, execute short entry
Risk Management Mechanism:
- Stop-loss setting: Long stop-loss set at low price minus 1.5 times ATR, short stop-loss set at high price plus 1.5 times ATR
- Take-profit setting: Long take-profit set at closing price plus 2.5 times ATR, short take-profit set at closing price minus 2.5 times ATR
Strategy Advantages
Through in-depth analysis of the strategy’s code implementation, the following significant advantages can be summarized:
Precise Pattern Recognition: The strategy uses strict mathematical definitions to identify Hammer and Shooting Star patterns, reducing errors from subjective judgment and improving signal accuracy.
ATR Volatility Filtering: Using ATR as a filtering condition ensures trade signals are triggered only in environments with significant price movement, effectively reducing false breakouts and noise signals.
Signal Confirmation Mechanism: Relies not only on pattern recognition but also requires confirmation through closing and opening price crossovers, further enhancing signal reliability.
Dynamic Risk Management: ATR-based stop-loss and take-profit settings allow the risk management mechanism to automatically adjust according to market volatility, offering more flexibility and adaptability than fixed-point stop-loss and take-profit approaches.
Visualization Implementation: The strategy visually displays trading signals on charts, facilitating quick identification and verification by traders.
Capital Management Integration: Adopts account equity proportion as the default position management method, ensuring consistent risk exposure across different account sizes.
Automation-Friendly: Clear code structure, suitable for integration with automated trading systems like AutoView for fully automated trading.
Strategy Risks
Despite its numerous advantages, there are several potential risks and limitations when applying this strategy in practice:
False Signal Risk: Despite using ATR filtering, candlestick pattern recognition may still generate false signals under certain market conditions, especially in highly volatile or frequently oscillating market environments.
Parameter Sensitivity: ATR multiplier, stop-loss, and take-profit multiplier parameter settings significantly impact strategy performance, and different market environments may require different parameter configurations.
Trend Dependency: This strategy primarily identifies potential reversal points, but in strong trending markets, reversal signals may appear frequently but not necessarily be effective.
Stop-Loss Range Consideration: The current stop-loss setting (1.5 times ATR) may lead to distant stop-loss points in high-volatility markets, increasing risk exposure for individual trades.
Signal Lag: As the strategy requires waiting for candle closing and pattern confirmation, signals may be generated after prices have already moved significantly, missing optimal entry points.
To address these risks, the following solutions can be implemented: - Combine additional technical indicators or market structure analysis to filter signals - Optimize parameter configurations for different markets and timeframes - Consider disabling counter-trend signals in strong trending environments - Add time filters to avoid trading during important news releases or low liquidity periods - Consider using more flexible position management strategies, adjusting trade size based on signal strength
Strategy Optimization Directions
Based on in-depth analysis of the strategy code, the following optimization directions can be proposed:
Trend Filtering: Integrate trend indicators (such as moving averages, ADX, etc.) to accept signals only when aligned with the main trend direction or give higher weight to trend-following signals. This can significantly reduce false reversal signals received during strong trends.
Multi-Timeframe Analysis: Introduce higher timeframe confirmation mechanisms, for example, executing trades only when daily and 4-hour charts show signals in the same direction. This approach can improve signal quality and success rate.
Volume Confirmation: Add volume analysis dimension, requiring significant volume increase during pattern confirmation. This is crucial for verifying market participants’ acknowledgment of the reversal.
Dynamic Parameter Optimization: Implement parameter self-adaptive mechanisms based on historical volatility or market states, for example, automatically adjusting ATR multipliers and risk management parameters at different VIX levels or market stages.
Stop-Loss Strategy Enhancement: Consider implementing trailing stop-loss functionality, especially for profitable trades. This can protect existing profits while allowing trends to continue developing.
Signal Strength Grading: Grade signals based on pattern perfection (such as wick length ratio, body size, etc.) and adjust position size accordingly. This differentiated management can better reflect signal credibility.
Time Filtering: Add trading time filters to avoid low liquidity periods or major economic data release periods, reducing false signals caused by abnormal volatility.
Market Environment Recognition: Develop a market state classification system, applying different trading rules or parameter settings in different types of markets (trending, range-bound, high volatility, etc.).
Implementing these optimization directions can significantly enhance the strategy’s robustness and adaptability, enabling it to maintain good performance across a wider range of market environments.
Conclusion
The ATR-Enhanced Candlestick Reversal Pattern Recognition and Risk Management Strategy is a trading system that combines traditional technical analysis methods with modern quantitative risk management techniques. Its core value lies in improving the accuracy and reliability of candlestick pattern recognition through strict mathematical definitions and ATR filtering mechanisms, while adopting dynamic risk management methods based on market volatility for effective control of trading risks.
The most significant feature of this strategy is the organic integration of pattern recognition, signal confirmation, and risk management dimensions to form a complete trading system. Despite some potential risks and limitations, through the suggested optimization directions—especially adding trend filtering, multi-timeframe analysis, and dynamic parameter optimization techniques—the overall performance of the strategy can be further enhanced.
For traders, this strategy provides a systematic framework for understanding and applying candlestick patterns, particularly suitable for those looking to introduce risk management dimensions on the basis of technical analysis. Through reasonable parameter adjustments and optimizations targeting specific market characteristics, this strategy has the potential to maintain stable performance under various market conditions.
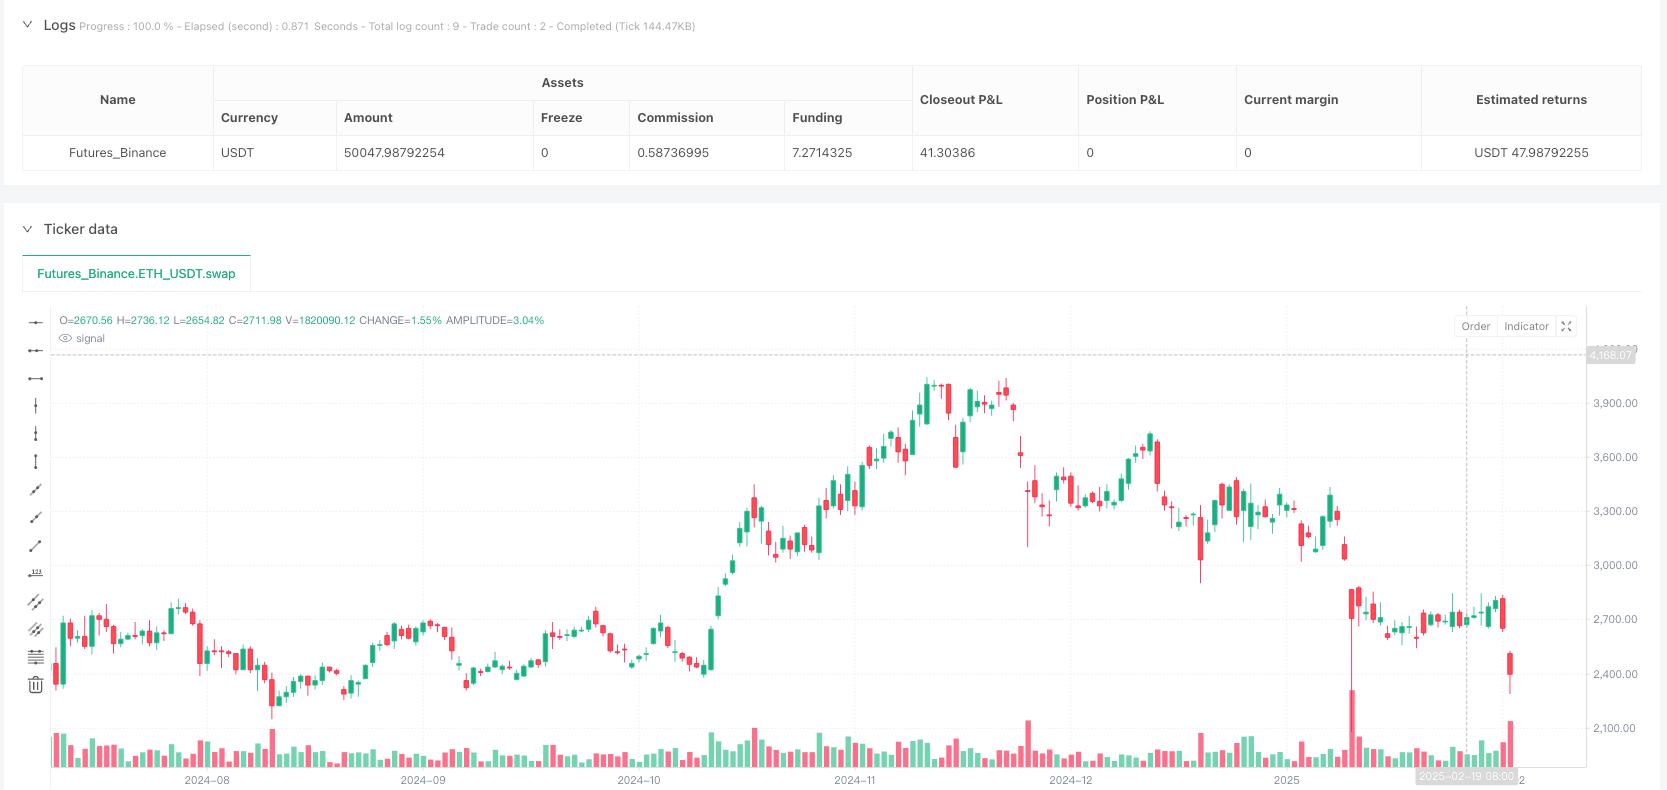
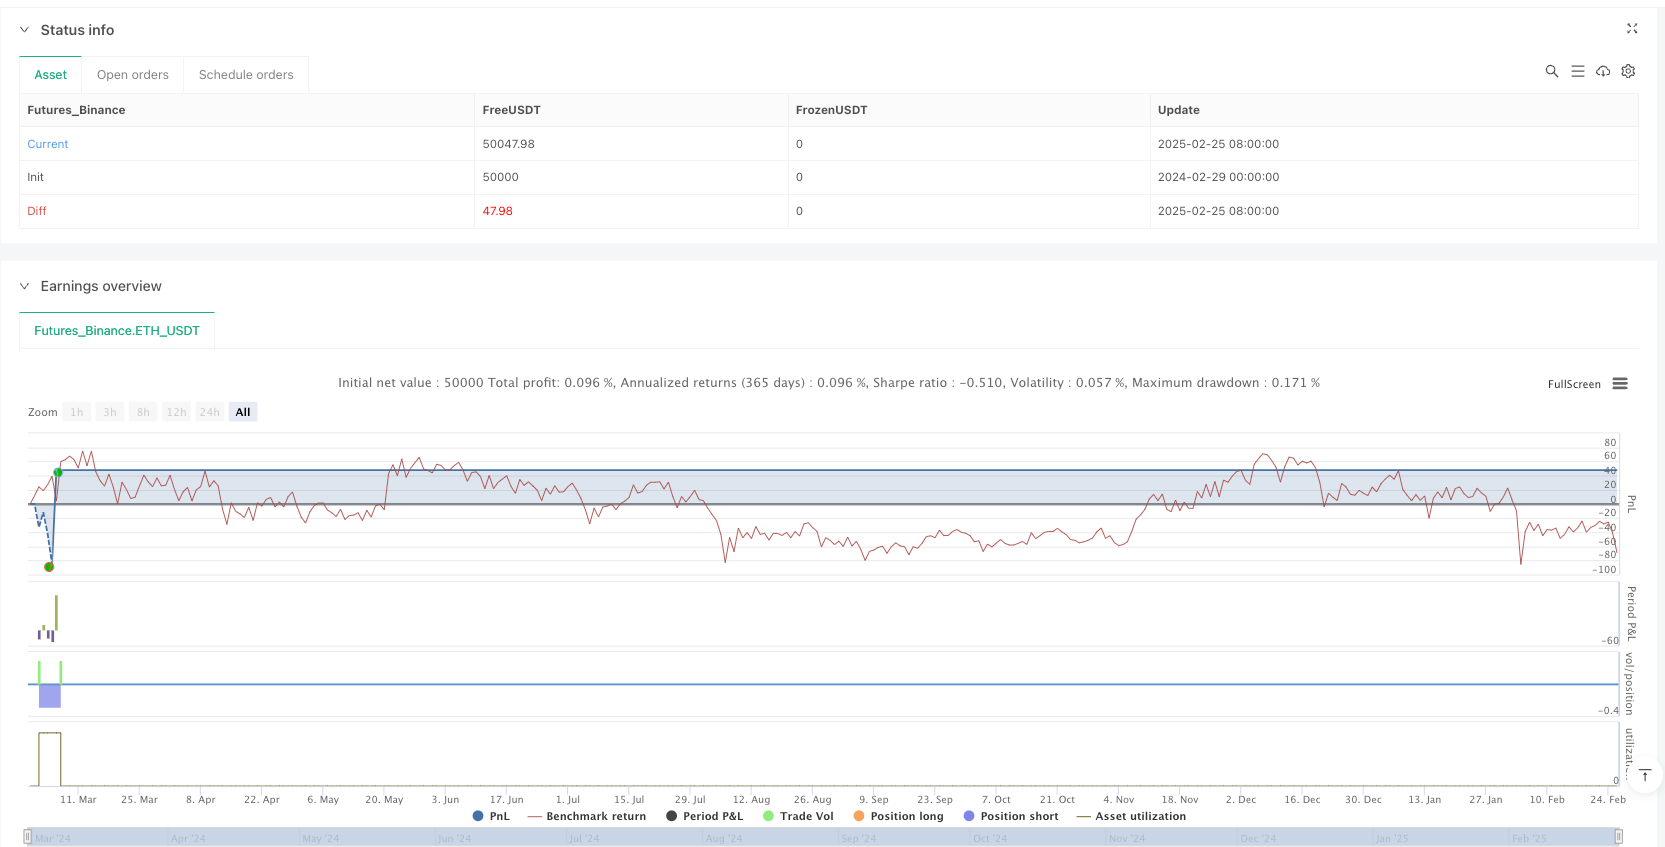
/*backtest
start: 2024-02-29 00:00:00
end: 2025-02-26 08:00:00
period: 1d
basePeriod: 1d
exchanges: [{"eid":"Futures_Binance","currency":"ETH_USDT"}]
*/

//@version=5
strategy("Hammers & Stars Strategy", overlay=true, default_qty_type=strategy.percent_of_equity, default_qty_value=2)

// ATR Filter
atrLength = 14
atrMultiplier = 1.5
atrValue = ta.atr(atrLength)

// Candlestick Pattern Definitions
bodySize = math.abs(close - open)
wicksUpper = high - math.max(close, open)
wicksLower = math.min(close, open) - low
totalRange = high - low

// Hammer Pattern (Bullish Reversal)
isHammer = wicksLower > (2 * bodySize) and wicksUpper < bodySize and totalRange > atrMultiplier * atrValue
hammerSignal = isHammer and ta.crossover(close, open)  // Confirmation

// Shooting Star Pattern (Bearish Reversal)
isShootingStar = wicksUpper > (2 * bodySize) and wicksLower < bodySize and totalRange > atrMultiplier * atrValue
shootingStarSignal = isShootingStar and ta.crossunder(close, open)  // Confirmation

// Entry Conditions
if hammerSignal
    strategy.entry("Hammer Buy", strategy.long)
if shootingStarSignal
    strategy.entry("ShootingStar Sell", strategy.short)

// Stop Loss & Take Profit
slMultiplier = 1.5
tlMultiplier = 2.5
longStopLoss = low - slMultiplier * atrValue
longTakeProfit = close + tlMultiplier * atrValue
shortStopLoss = high + slMultiplier * atrValue
shortTakeProfit = close - tlMultiplier * atrValue

strategy.exit("Take Profit / Stop Loss", from_entry="Hammer Buy", stop=longStopLoss, limit=longTakeProfit)
strategy.exit("Take Profit / Stop Loss", from_entry="ShootingStar Sell", stop=shortStopLoss, limit=shortTakeProfit)

// Plot Signals on Chart
plotshape(hammerSignal, location=location.belowbar, color=color.green, style=shape.labelup, title="Hammer")
plotshape(shootingStarSignal, location=location.abovebar, color=color.red, style=shape.labeldown, title="Shooting Star")