
Overview
This is a comprehensive quantitative trading strategy that integrates multi-timeframe analysis with technical indicator confirmation. The core of the strategy lies in evaluating market trend strength through moving average crossovers across different time periods (H1, H4, and daily), combined with momentum indicators such as RSI and MACD for trade signal confirmation. The system is equipped with a sophisticated money management mechanism, employing dynamic ATR-based stop-loss and take-profit levels, and implementing a compound exit strategy with partial profit-taking and trailing stops. This strategy is particularly suitable for forex and precious metals markets, designed to capture medium to long-term trending movements while effectively controlling risk.
Strategy Principles
The core principle of this strategy is multi-dimensional market trend analysis and confirmation:
-
Multi-Timeframe Trend Scoring System:
- Calculates a comprehensive trend score by comparing fast (50-period) and slow (200-period) moving averages across three timeframes (H1, H4, and daily)
- H1 timeframe is weighted ±1 point, H4 timeframe ±2 points, and daily timeframe ±3 points
- Positive scores are assigned when the fast MA is above the slow MA, negative when below, with the final score being the sum across all timeframes
-
Entry Conditions:
- Long Entry: Trend score ≥3, price above H1 fast moving average, RSI>50, MACD line>signal line
- Short Entry: Trend score ≤-3, price below H1 fast moving average, RSI<50, MACD line<signal line
-
Risk Management and Exit Strategy:
- Position sizing: Based on account balance and set leverage (lots per $1000), while limiting single trade risk to no more than 2% of the account
- Stop-loss: Dynamically calculated at 2x ATR distance
- Stepped profit-taking: 50% position closed at 1x ATR profit, remaining 50% with 3x ATR target and trailing stop mechanism
-
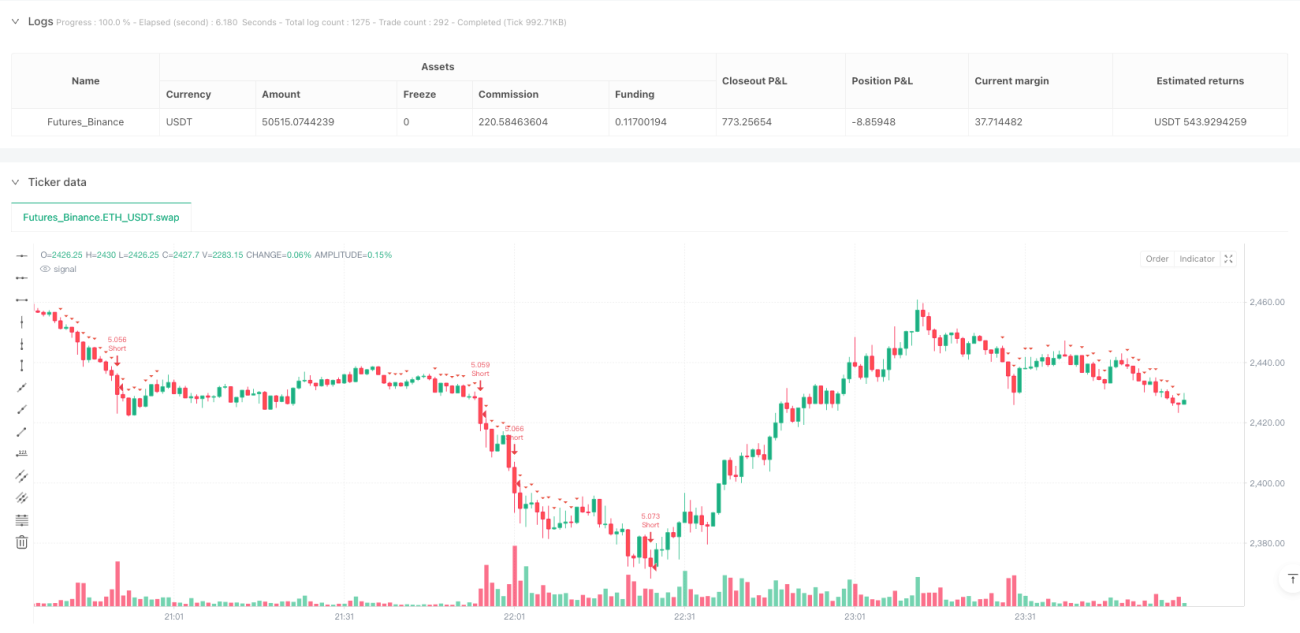
Control Panel:
- Real-time display of moving average values and relationships across timeframes
- Visualization of current score and trade signal recommendations (buy, sell, or neutral)
Strategy Advantages
-
Multi-dimensional Trend Confirmation: By integrating trend information from three timeframes, the strategy can more accurately identify strong trends, effectively filtering out false signals and noise. Higher weights are assigned to longer timeframes, aligning with the principle of long-term trend priority in technical analysis.
-
Multiple Entry Signal Validation: Besides trend scoring, the strategy requires specific conditions for price, RSI, and MACD indicators to be met simultaneously, significantly improving signal quality through this multi-confirmation mechanism.
-
Intelligent Risk Management:
- Dynamic stop-loss based on market volatility (ATR), adapting to different market conditions
- Stepped profit-taking strategy balances securing gains and following trends
- Position size automatically adjusts based on account size, ensuring consistent capital allocation
-
Visual Decision Support: The control panel intuitively displays trend status across timeframes and the composite score, helping traders quickly assess market conditions and enhancing decision confidence.
-
High Adaptability: The strategy can be applied to various trading instruments, performing particularly well in forex pairs and precious metals with distinct trends.
Strategy Risks
-
Trend Reversal Risk: Despite enhanced accuracy through multi-timeframe analysis, the strategy may still face significant drawdowns during strong market reversals. Consider temporarily reducing position size or pausing trading before major economic data releases or events.
-
Overtrading Risk: When markets are range-bound, the trend score may frequently fluctuate around threshold values, causing repeated entries and exits. A solution is to add an additional range-market filter, such as ATR percentage or volatility indicators.
-
Parameter Sensitivity: Strategy performance is sensitive to SMA periods (50/200) and ATR multiplier settings. Comprehensive historical backtesting is recommended to optimize parameters, with periodic evaluation of whether they remain suitable for current market conditions.
-
Money Management Limitations: The current fixed proportion risk model may not be flexible enough in extreme market conditions. Consider introducing volatility-adjusted position sizing to automatically reduce positions during highly volatile periods.
-
Execution Delay Risk: In fast markets, the multiple confirmations required by the strategy may lead to delayed entries, missing optimal prices. To mitigate this risk, consider adding early entry signals based on price action.
Strategy Optimization Directions
-
Improved Trend Identification Mechanism:
- Replace Simple Moving Averages (SMA) with Exponential Moving Averages (EMA) or Hull Moving Averages for faster trend identification
- Introduce trend strength indicators (such as ADX) as additional filters to ensure entries only in clear trends
- Consider adding distance evaluation between price and moving averages to avoid entries in overextended markets
-
Enhanced Signal Confirmation System:
- Add volume analysis to ensure trade direction aligns with volume trends
- Integrate price action pattern recognition (breakouts, retests, high-low formations) as auxiliary confirmation
- Incorporate seasonality and market sentiment indicators to improve signal quality
-
Optimized Exit Mechanism:
- Implement dynamic take-profit adjustments based on market state, allowing for larger profit targets in strong trends
- Add moving average crossovers or trend score changes as early exit signals for partial positions
- Develop time-based stops based on volatility cycles to avoid trades that remain unprofitable for extended periods
-
Enhanced Risk Management:
- Implement correlation-sensitive risk allocation to avoid excessive risk concentration in highly correlated markets
- Add daily, weekly, and monthly maximum drawdown limits that automatically reduce position size or pause trading when triggered
- Develop a dynamic leverage adjustment system based on market volatility
-
Improved System Adaptability:
- Develop parameter self-adaptation mechanisms that automatically adjust key parameters based on different market phases
- Introduce machine learning algorithms to optimize trend score weight distribution
- Add news event filters to pause trading before and after important economic data releases
Summary
The Multi-Timeframe Trend Following and Momentum Confirmation Quantitative Trading Strategy is a comprehensive, systematic trading solution that generates high-quality trading signals by integrating trend information from multiple timeframes and technical indicator confirmations. Its greatest strength lies in the multi-layered trend identification and signal confirmation mechanisms, effectively improving signal quality; meanwhile, the dynamic risk management based on market volatility and stepped profit-taking strategy provide solid protection for capital safety.
The main risks of the strategy include potential drawdowns during trend reversal periods and parameter sensitivity. Through the suggested optimization directions, such as improving the trend identification mechanism, enhancing the signal confirmation system, optimizing the exit mechanism, strengthening risk management, and increasing system adaptability, this strategy can further improve its stability and profitability across various market environments.
For traders looking to capture medium to long-term trend opportunities in forex and precious metals markets, this is a theoretically sound and highly practical strategy framework. After thorough backtesting and appropriate parameter optimization, it can be used as a core component of systematic trading or as a standalone trading system.
- 1