Multi-Dimensional Chart Pattern Quantitative Strategy: A Technical Analysis Trading System Integrating Head and Shoulders and Double Top/Bottom Formations


Overview
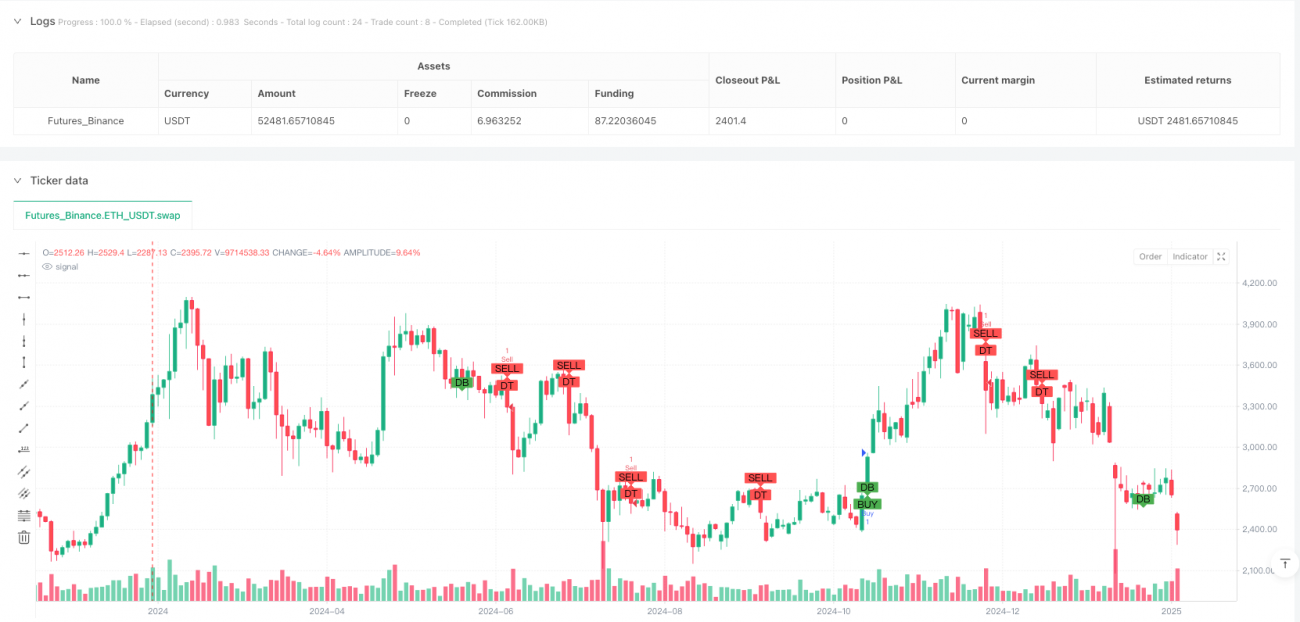
The Multi-Dimensional Chart Pattern Quantitative Strategy is a trading system based on the identification of classic chart formations in technical analysis, focusing mainly on reversal patterns such as Head and Shoulders and Double Tops/Bottoms. This strategy programmatically defines and identifies these key formations in the market, combining the ATR (Average True Range) indicator to set stop-loss and take-profit levels, thus building a complete trading framework. The core of this strategy lies in capturing critical turning points in market trends, especially when prices form specific structural patterns that often indicate an imminent shift from uptrend to downtrend or vice versa.
Strategy Principles
The core principles of this strategy revolve around identifying three main chart patterns:
-
Head and Shoulders Pattern Recognition: Identified through sequential comparison of price highs. The strategy detects whether a central high point (head) is higher than the highs on either side (shoulders), confirming a pattern when
high[1] > high[2] && high[1] > high[0] && high[1] > high[3] && high[1] > high[4] && high[0] < high[2] && high[0] < high[3]. This pattern typically signals the end of an uptrend and the potential beginning of a downtrend. -
Double Top Pattern Recognition: Using logic similar to the Head and Shoulders, but focusing more on two nearby highs. When two close price peaks form with a significant low between them, it's considered a Double Top pattern, which is also a bearish reversal signal.
-
Double Bottom Pattern Recognition: Opposite to the Double Top, identified by recognizing two close price lows with a high between them. When
low[1] < low[2] && low[1] < low[0] && low[1] < low[3] && low[1] < low[4] && low[0] > low[2] && low[0] > low[3], it's identified as a Double Bottom pattern, typically a bullish reversal signal.
Trade signal generation is based on pattern recognition combined with price action:
- Buy signal: When a Double Bottom pattern is identified and the current closing price is higher than the opening price (
doubleBottomPattern && close > open) - Sell signal: When a Double Top pattern is identified and the current closing price is lower than the opening price (
doubleTopPattern && close < open)
Risk management is implemented through the ATR (Average True Range) indicator:
- Stop-loss is set at 1.5 times the ATR value (
stopLoss = atrValue * 1.5) - Take-profit is set at 3 times the ATR value (
takeProfit = atrValue * 3)
This design allows the strategy to adapt to different market volatilities, providing wider stops in high-volatility markets and relatively narrower stops in low-volatility markets.
Strategy Advantages
-
Based on Classical Technical Analysis: The strategy is based on widely recognized and applied chart pattern analysis, which has shown a certain degree of effectiveness in various market environments and has a large amount of historical validation data.
-
Adaptive Risk Management: By using the ATR indicator to set stop-loss and take-profit levels, the strategy can automatically adjust risk management parameters according to actual market volatility, avoiding excessive risk or excessive conservatism that might come with fixed-point stops.
-
Clear Entry and Exit Rules: The strategy provides clear entry (pattern confirmation + price confirmation) and exit (ATR-based stop-loss/take-profit) conditions, helping traders maintain discipline and reduce emotional trading.
-
Visualized Trading Signals: Through the
plotshapefunction, pattern recognition and trading signals are intuitively displayed on the chart, facilitating real-time monitoring and analysis of strategy performance. -
Flexible Adaptability: While the current implementation mainly focuses on several specific chart patterns, the strategy framework allows for easy expansion to include more different types of pattern recognition, such as triangles, flags, wedges, etc.
Strategy Risks
-
Simplified Pattern Recognition: The current pattern recognition logic is relatively simplified, based only on the comparison of a few price points, and may not capture more complex market structures, leading to some misjudgments. For example, the identification logic for Head and Shoulders and Double Top is the same, which may lead to misclassification.
-
Lack of Volume Confirmation: In traditional technical analysis, chart patterns often need to be confirmed by volume, but the current strategy does not incorporate volume factors, which may lead to incomplete judgment of pattern validity.
-
Fixed ATR Multiple Risk: Although using ATR allows stop-loss/take-profit to adapt to volatility, the fixed parameters of 1.5 and 3 times may not be applicable to all market environments, especially in extreme market conditions or sudden events.
-
No Timeframe Consideration: The strategy does not consider the differences in pattern recognition across different timeframes, which may result in too many false signals on shorter timeframes or missed important trading opportunities on longer timeframes.
-
Lack of Trend Filtering: The strategy has no trend filtering mechanism, which may lead to frequent triggering of reverse trading signals in strong trend markets, resulting in a series of losing trades.
Strategy Optimization Directions
-
Improve Pattern Recognition Algorithms:
- Differentiate the recognition logic between Head and Shoulders and Double Top, and add more parameters to improve recognition accuracy
- Add judgment of pattern proportion and symmetry, for example, the head should be significantly higher than the shoulders, and the heights of the two shoulders should be similar
- Introduce pattern completeness scoring, adjusting the credibility of trading signals based on how standard the pattern is
-
Integrate Volume Analysis:
- Add volume confirmation conditions in pattern recognition, for example, in a Head and Shoulders pattern, the volume at the head should be higher than at the right shoulder
- Volume should significantly increase during pattern breakout, which can be used as a reinforcing condition for trading signals
-
Optimize Risk Management Strategy:
- Introduce dynamic ATR multiples, adjusting stop-loss/take-profit ratios based on changes in market volatility, pattern size, or market environment
- Implement stepped stop-loss, gradually adjusting stop-loss positions as the trade moves in a favorable direction
- Add partial profit-taking mechanisms to lock in profits and reduce overall risk
-
Add Trend Filters:
- Incorporate moving averages or other trend indicators to filter trading signals, entering only in the direction that aligns with the main trend
- Confirm trend consistency across different periods to avoid frequent trading against larger trends
-
Multi-Timeframe Analysis:
- Extend the strategy to multi-timeframe analysis, using longer periods to determine the main trend direction and shorter periods to find precise entry points
- Introduce timeframe consistency scoring to improve the quality of trading signals
-
Add Supplementary Confirmation Indicators:
- Integrate indicators such as RSI, MACD as auxiliary confirmation tools to improve the reliability of trading signals
- Consider market cycle and seasonality factors, increasing trading frequency or position size during high win-rate periods
Summary
The Multi-Dimensional Chart Pattern Quantitative Strategy is a trading system based on classical technical analysis chart patterns, programmatically identifying market structures such as Head and Shoulders and Double Tops/Bottoms to capture potential trend turning points. This strategy combines the ATR indicator for risk management, providing a relatively complete trading framework. The main advantages of the strategy lie in its basis in widely validated technical analysis theory, clear trading rules, and adaptive risk management mechanisms. However, the simplified pattern recognition logic, lack of volume confirmation, and trend filtering in the current implementation are the main risk points.
To enhance the robustness and performance of the strategy, it is recommended to improve it in aspects such as perfecting pattern recognition algorithms, integrating volume analysis, optimizing risk management strategies, adding trend filters, implementing multi-timeframe analysis, and increasing auxiliary confirmation indicators. Through these improvements, the strategy is expected to significantly improve the quality of trading signals and overall profitability while maintaining its advantages based on classical chart pattern analysis.
Ultimately, any trading strategy needs to undergo thorough backtesting and live market validation. In practical application, appropriate parameter adjustments should be made in conjunction with changes in market environment, characteristics of trading instruments, and individual risk tolerance to achieve optimal trading results.
/*backtest
start: 2024-02-28 00:00:00
end: 2025-02-26 08:00:00
period: 2d
basePeriod: 2d
exchanges: [{"eid":"Futures_Binance","currency":"ETH_USDT"}]
*/

//@version=5
strategy("Chart Pattern Strategy - Head and Shoulders / Double Top/Bottom", overlay=true)

// Function to detect a simple Head and Shoulders pattern- 1