
Overview
The Dynamic Risk-Managed Rapid SMA Crossover Momentum Capture Strategy is a high-frequency trading approach designed specifically for capturing short-term market movements. This strategy combines multiple technical indicators including fast Simple Moving Averages (SMA), Relative Strength Index (RSI), and Moving Average Convergence/Divergence (MACD), while incorporating a dynamic risk management system based on Average True Range (ATR). This combination allows the strategy to quickly identify trading opportunities in volatile environments while strictly controlling risk exposure per trade.
Strategy Principles
The core logic of this strategy is built on the coordinated confirmation of short-term technical indicators, relying on the following key components:
-
Fast Moving Average System: The strategy uses 5-period and 20-period Simple Moving Averages (SMA) as primary trend indicators. A bullish signal component is identified when price is above the 5-period SMA and the 5-period SMA is above the 20-period SMA; the reverse conditions contribute to bearish signals.
-
Short-Term RSI Filter: A 10-period RSI serves as a momentum filter, with 45 set as the oversold threshold and 55 as the overbought threshold. These relatively neutral thresholds help capture early reversal signals in fast-moving markets.
-
Ultra-Fast MACD Confirmation: The strategy employs a MACD with parameters (5,13,3), which is more sensitive than traditional MACD settings. The relationship between the MACD line and signal line confirms trend direction.
-
ATR Adaptive Stop Loss and Profit Targets: A 10-period ATR calculates dynamic stop-loss and take-profit levels, with stop-loss set at 1.2 times ATR and profit targets at 2.5 times ATR, establishing a risk-reward ratio of over 2:1.
-
Dynamic Position Sizing: The strategy dynamically calculates position size for each trade based on account equity and predetermined risk percentage (default 0.5%), ensuring consistent risk exposure regardless of market conditions.
Entry conditions require coordinated confirmation of these indicators: for long entries, the MACD line must be above the signal line, RSI above the oversold value of 45, closing price above the 5-period SMA, and the 5-period SMA above the 20-period SMA; short entries require the reverse confirmation of these conditions.
Strategy Advantages
-
Rapid Response to Market Changes: By utilizing short-period technical indicators, the strategy can quickly react to market movements, making it suitable for short-term and intraday traders.
-
Multi-Layer Confirmation Mechanism: Requiring multiple indicators to simultaneously confirm before triggering trade signals reduces the likelihood of false signals and improves signal quality.
-
Scientific Risk Management: Dynamic stop-loss levels calculated through ATR allow the protection level to adapt to market volatility, automatically increasing protection when volatility rises and avoiding premature stops in calm markets.
-
Fixed Percentage Risk Control: Each trade risks only 0.5% of the account, effectively protecting capital even during consecutive losses.
-
Optimized Risk-Reward Ratio: The risk-reward setting of over 2:1 means that even with a win rate of only 40%, profitability may be achievable in the long term.
-
Visualization of Trading Signals: The strategy provides clear visual cues, helping traders intuitively identify entry opportunities.
Strategy Risks
-
High-Frequency Trading Costs: As a rapid trading strategy, it may generate frequent trading signals, resulting in high transaction fees, especially during price consolidations. Solution: Add additional filtering conditions or extend holding periods.
-
False Breakout Risk: Fast indicators are highly sensitive to short-term price movements and may trigger signals during false breakouts. This risk can be mitigated by adding volume confirmation or volatility filters.
-
Trend Reversal Risk: The strategy performs best in strong trending environments but may face significant losses when markets suddenly reverse. Consider reducing position size before major economic data releases or important events.
-
Parameter Optimization Overfitting: Current parameter settings may perform well in historical backtests but could decline in effectiveness as market conditions change. Regularly re-evaluate and adjust parameters, or implement adaptive parameter techniques.
-
Gap Risk for Stop Losses: In low-liquidity or high-volatility markets, prices may gap beyond set stop-loss levels. Consider using options strategies or other derivatives to hedge against gap risk.
Strategy Optimization Directions
-
Add Volume Filters: The current strategy is based solely on price action; adding volume confirmation can improve signal quality. When price breakouts are accompanied by increased volume, signal reliability significantly improves.
-
Implement Market State Recognition: Add volatility indicators (such as Bollinger Band Width) to identify market states; parameters may need adjustment or trading frequency reduced in high-volatility environments.
-
Optimize Multiple Timeframe Analysis: Consider incorporating multiple timeframe analysis, only trading when larger timeframe trends align with the signal direction, which can improve win rates.
-
Enhance Dynamic Parameter Adjustment: Currently using fixed indicator parameters, the strategy could be improved by automatically adjusting parameters based on market volatility, such as extending moving average periods when volatility increases.
-
Integrate Machine Learning Elements: Optimize entry timing through machine learning algorithms, particularly using random forests or support vector machines to predict short-term price movements and improve prediction accuracy.
-
Improve Money Management: While the strategy already implements basic risk control, consider adding compounding effects or moderately increasing position sizes after consecutive profitable trades.
Conclusion
The Dynamic Risk-Managed Rapid SMA Crossover Momentum Capture Strategy is a technically-oriented short-term trading system that provides a systematic approach to capturing market movements quickly through the integration of multiple indicators and a strict risk management framework. Its core strengths lie in its rapid response to market changes, multi-layer indicator confirmation, and scientific risk control system. Despite risks such as high-frequency trading costs and false breakouts, the strategy's robustness and adaptability can be further enhanced through the suggested optimization directions, including volume confirmation, market state recognition, and machine learning elements. For traders seeking to capture market movements in short timeframes while strictly controlling risk, this strategy provides a solid starting point, though it should be appropriately adjusted according to individual risk preferences and market experience.
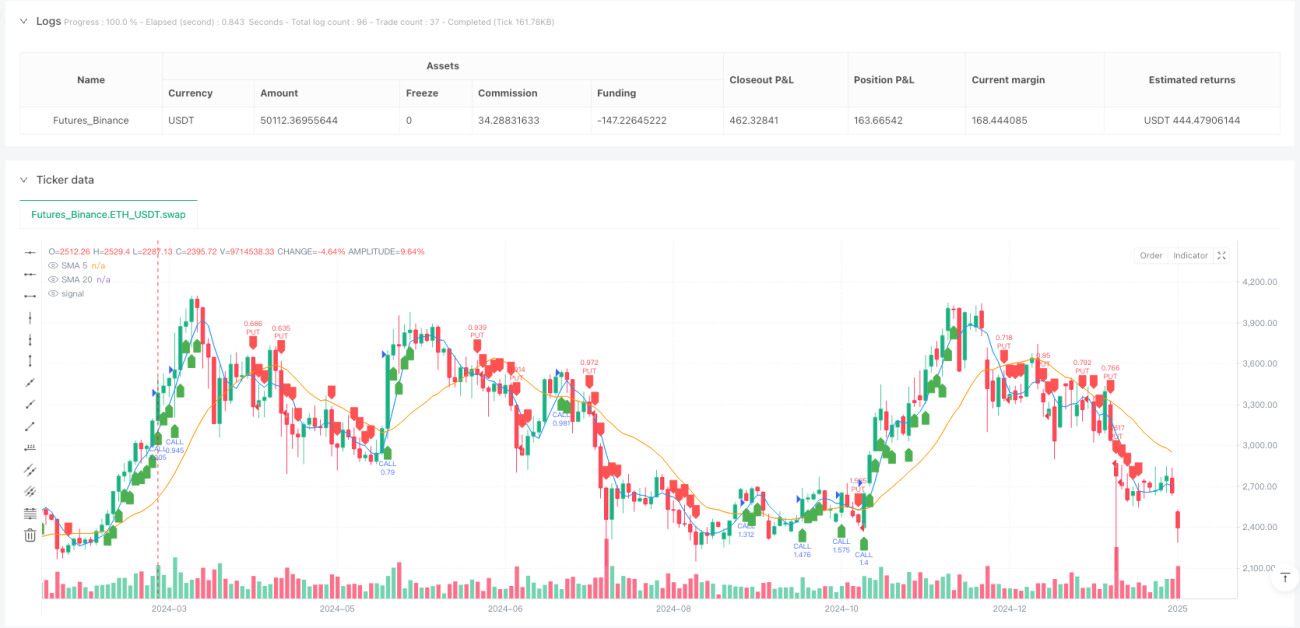
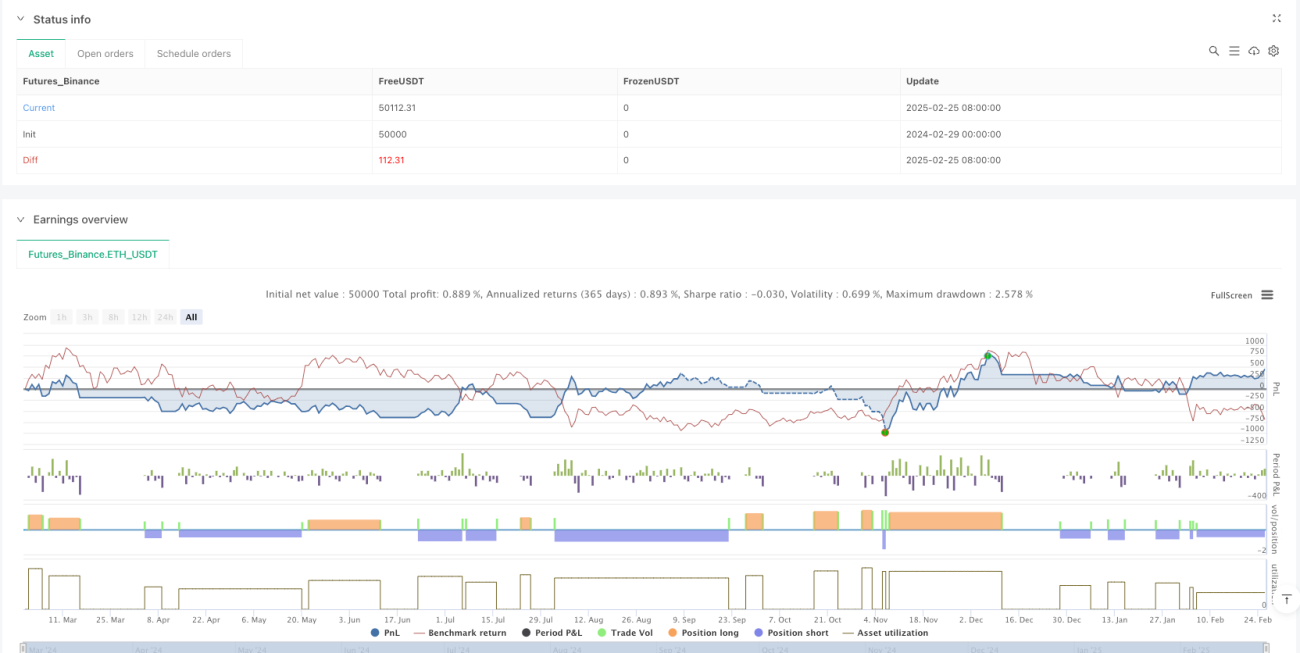
/*backtest
start: 2024-02-29 00:00:00
end: 2025-02-26 08:00:00
period: 2d
basePeriod: 2d
exchanges: [{"eid":"Futures_Binance","currency":"ETH_USDT"}]
*/

//@version=5
strategy("Stock & Options Hyper-Scalper", overlay=true, default_qty_type=strategy.percent_of_equity, default_qty_value=1)

// === Inputs ===- 1