Multi-Timeframe EMA Crossover Trend Following Strategy with Support/Resistance and Smart Trailing Stop System

Overview
This strategy is a trend-following trading system that incorporates multi-timeframe analysis, primarily based on crossover signals from three different exponential moving averages (EMAs), supplemented with higher timeframe support and resistance levels. The core of the strategy lies in utilizing the crossing relationships between EMA5, EMA8, and EMA13 to generate buy and sell signals, while implementing a percentage-based smart trailing stop mechanism to protect profits and limit potential losses. The entire system is designed to focus on trading with the trend while providing clear entry and exit rules and a risk management framework.
Strategy Principles
Through in-depth code analysis, the operational principles of this strategy are as follows:
-
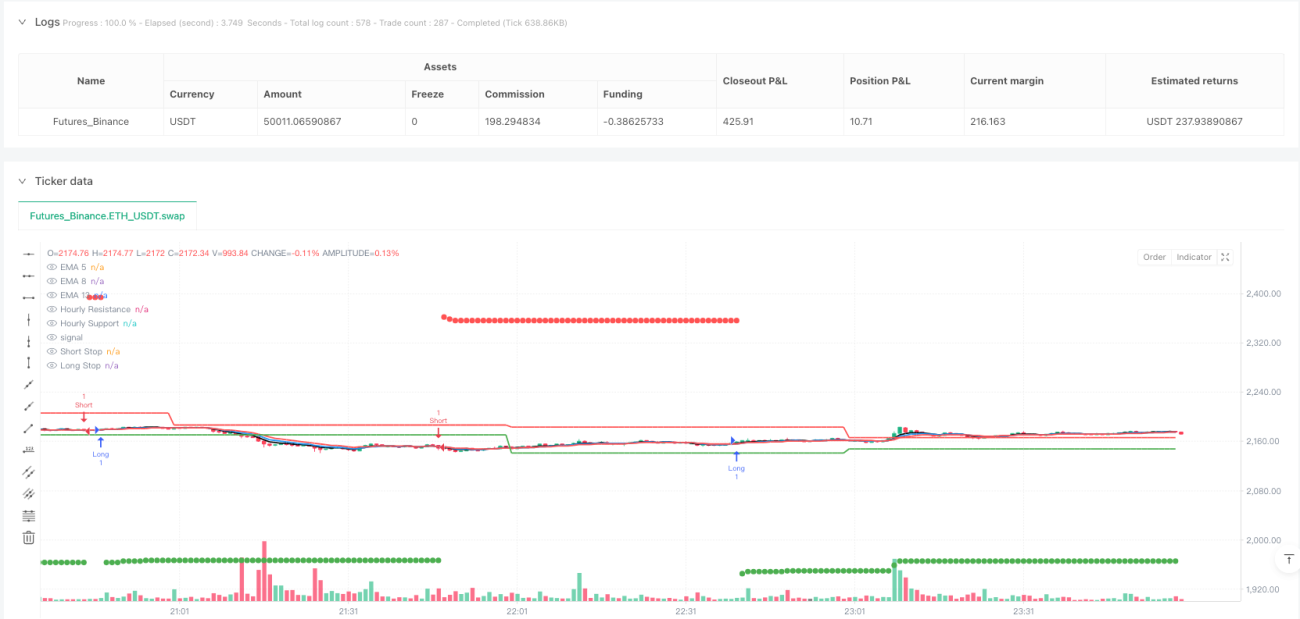
Signal Generation:
- Buy Signal: Triggered when the short-term EMA5 simultaneously crosses above the medium-term EMA8 and long-term EMA13
- Sell Signal: Triggered when the short-term EMA5 simultaneously crosses below the medium-term EMA8 and long-term EMA13
-
Higher Timeframe Filtering:
- The strategy incorporates high and low points from the 1-hour chart as support and resistance levels
- These levels are displayed on the chart as red (resistance) and green (support) lines, helping traders identify potential price reversal zones
-
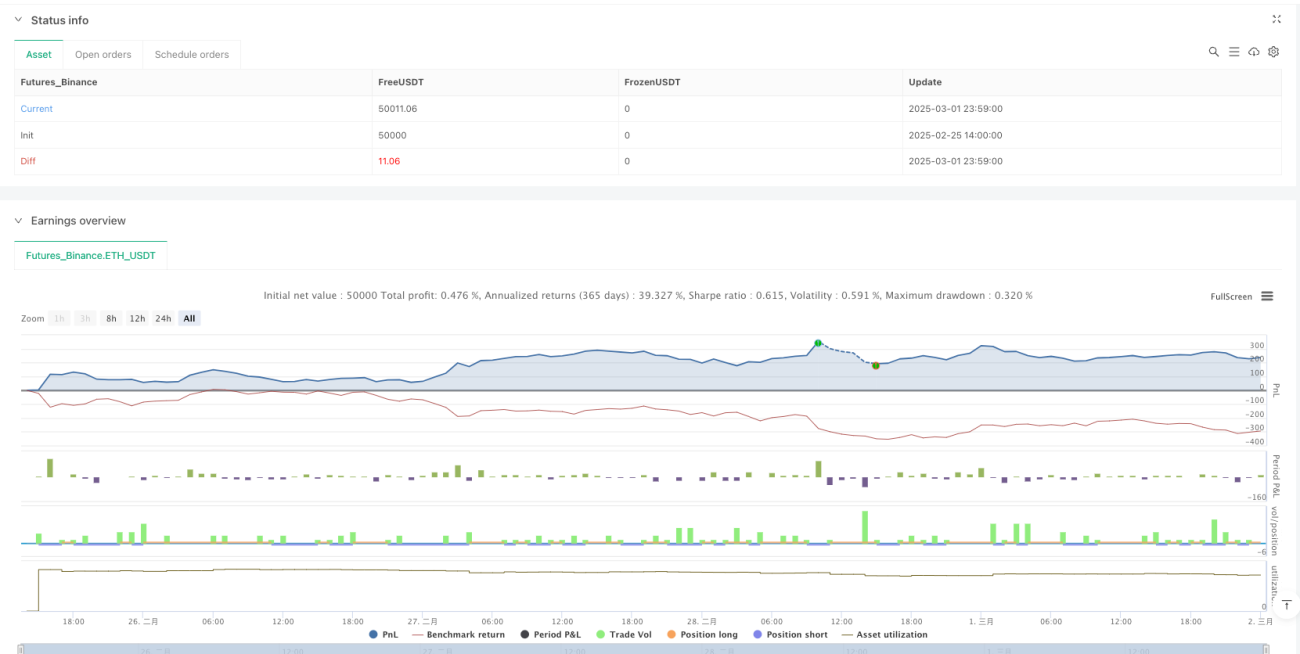
Risk Management:
- Implements a percentage-based trailing stop based on user-defined parameters (default 0.10%)
- For long positions, the stop loss is set at trailOffset percentage below the highest price
- For short positions, the stop loss is set at trailOffset percentage above the lowest price
- The stop loss level continuously adjusts as the price moves in a favorable direction, locking in profits
-
Graphical Feedback:
- Trade exit points are highlighted on the chart with cross markers
- Trailing stop levels are marked with circles, providing intuitive visualization of risk control levels
Strategy Advantages
This strategy offers several notable advantages:
-
Multiple Signal Confirmation: Requiring EMA5 to simultaneously cross both EMA8 and EMA13 reduces the possibility of false breakouts and increases signal reliability.
-
Multi-Timeframe Analysis: Integration of higher timeframe (1-hour) support and resistance levels helps traders consider trading decisions from a more macroscopic market structure perspective.
-
Smart Dynamic Stop Loss: Unlike fixed stop losses, the trailing stop mechanism allows profits to continue growing while protecting capital, improving the risk-reward ratio.
-
Clear Visual Feedback: By plotting key indicators, signals, and exit points on the chart, traders can intuitively understand market conditions and strategy logic.
-
Bidirectional Trading Capability: The strategy supports both long and short trading, seeking opportunities in various market environments to maximize profit potential.
-
Parameterized Risk Control: The trailing stop offset can be adjusted by users (0.01% to 1%), allowing flexible risk parameter settings based on personal risk preferences and market conditions.
Strategy Risks
Despite its many advantages, the strategy also presents the following potential risks:
-
Choppy Market Risk: In sideways markets without clear trends, EMA crossovers may produce frequent false signals, leading to consecutive losses. The solution is to add market structure or volatility filters and only trade when trends are clearly defined.
-
Trailing Stop Gap Risk: In cases of rapid fluctuations or overnight gaps, prices may jump past trailing stop levels, causing actual stop-loss prices to be far lower than expected. Consider adding fixed maximum loss limits as additional protection.
-
Parameter Sensitivity: Strategy performance highly depends on the chosen EMA periods and trailing stop percentage; different markets and timeframes may require different parameter settings. Parameters should be validated through comprehensive backtesting before live trading.
-
Lack of Volatility Adaptation: The current version of trailing stop is based on a fixed percentage, which may be too tight in high-volatility markets and too loose in low-volatility markets. Consider adjusting trailing stop distances based on ATR.
-
Signal Conflicts: Under certain market conditions, EMA crossover signals may contradict support/resistance levels from the 1-hour chart, making trading decisions difficult. In such cases, clear priority rules should be established or wait for signal alignment.
Strategy Optimization Directions
Based on code analysis, here are potential directions for improving the strategy:
-
Introduce ATR Dynamic Stop Loss: Replace fixed percentage trailing stops with dynamic stops based on Average True Range (ATR) to better adapt to different market volatility characteristics. This would provide wider stop space during high-volatility periods and tighter stops during low-volatility periods.
-
Add Trend Strength Filtering: Integrate the ADX (Average Directional Index) or similar trend strength indicators, executing trades only when strong trends are confirmed, avoiding frequent false signals in sideways markets.
-
Incorporate Volume Confirmation: Require trading signals to be accompanied by above-average volume, increasing the credibility of breakouts and reducing account erosion from false signals.
-
Implement Dynamic Risk Management: Automatically adjust position size based on account size, historical volatility, and win rate, optimizing capital growth potential while keeping risk controllable.
-
Optimize Higher Timeframe Filters: The current strategy uses the previous candlestick's high and low points from the 1-hour chart as support and resistance; consider introducing more complex support and resistance identification algorithms, such as key structural zones or multiple timeframe support and resistance combinations.
-
Add Market State Classification: Develop a market environment classification system (trend, range, high volatility, etc.) and adjust strategy parameters or trading logic for different market states to improve adaptability.
Conclusion
The Multi-Timeframe EMA Crossover Trend Following Strategy combines classic technical analysis elements with modern risk management techniques, providing traders with a structurally clear and rule-based trading system. Its core strengths lie in simple and intuitive signal generation logic while effectively controlling risk through the trailing stop mechanism to protect capital safety.
The strategy combines precise entry signals provided by short-term EMA crossovers with market structure perspective from higher timeframe support and resistance levels, helping traders capture high-probability trading opportunities when trend direction is clear. Although it may face challenges in oscillating markets, through the suggested optimization directions, especially adding trend strength filtering and ATR-based dynamic stops, the strategy's stability and performance across different market environments can be significantly enhanced.
For investors looking to build a systematic trading approach, this strategy provides a solid foundation framework that can be further customized and optimized according to personal risk preferences and trading goals. By strictly following strategy rules and maintaining trading discipline, traders can expect to achieve consistent returns in clearly trending markets.
- 1