
Overview
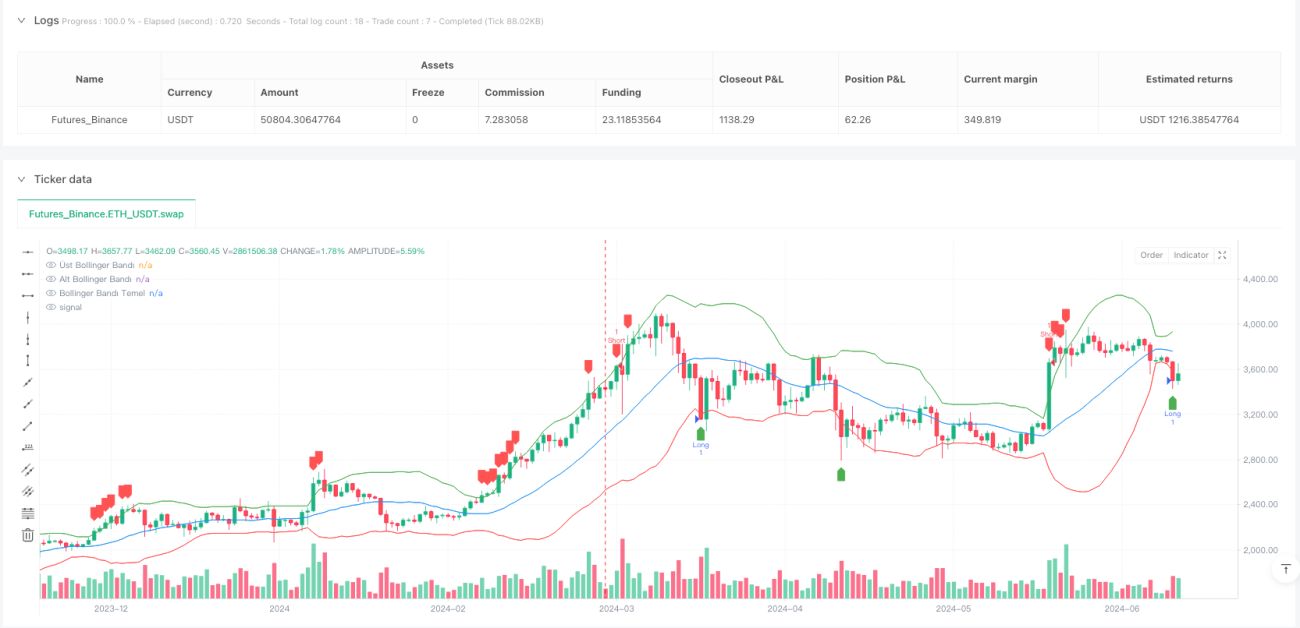
The Bollinger Bands ATR Risk-Reward Trading Strategy is a quantitative trading system that combines statistical volatility and price anomalies, primarily utilizing Bollinger Bands to identify oversold and overbought areas, while incorporating Average True Range (ATR) for risk management and precise stop-loss and take-profit placement. The core concept of this strategy is to go long when the price breaks below the lower Bollinger Band and short when it breaks above the upper band, while automatically calculating stop-loss and profit targets based on a predetermined risk-reward ratio.
Strategy Principles
The strategy is based on the statistical property of price mean reversion and precise risk management control:
-
Bollinger Bands Calculation: Uses a 20-period Simple Moving Average (SMA) as the middle band, with standard deviation multiplied by 2 to define the upper and lower bands. Bollinger Bands dynamically adapt to market volatility, providing relative overbought and oversold conditions for trading decisions.
-
Entry Signal Generation:
- When the closing price falls below the lower Bollinger Band, it's considered an oversold area, generating a long signal
- When the closing price rises above the upper Bollinger Band, it's considered an overbought area, generating a short signal
-
Risk Management Mechanism:
- Uses 14-period ATR to calculate market volatility
- Sets stop-loss at a distance of 2 times ATR from the entry price
- Automatically calculates profit targets based on the preset risk-reward ratio (default 2.0)
-
Risk-Reward Ratio: The strategy employs a risk-reward ratio (RR) parameter to optimize money management, ensuring that each trade's potential profit is a preset multiple of the potential risk, with a default value of 2.0, meaning the profit target is twice the stop-loss distance.
-
Automated Risk Control: Immediately after position entry, stop-loss and take-profit levels are set automatically, eliminating the need for manual intervention and reducing emotional decision-making.
Strategy Advantages
-
Volatility Adaptability: Bollinger Bands automatically adjust their width according to recent market volatility, allowing the strategy to adapt to different market environments without frequent parameter adjustments.
-
Objective Entry Logic: Entry signals are based on statistical principles rather than subjective judgment, reducing emotional trading. When prices exceed the statistical range, it often indicates a temporary extreme state with a high probability of mean reversion.
-
Dynamic Risk Management: Using ATR to calculate stop-loss distances allows automatic adjustment based on actual market volatility, avoiding the limitations of fixed-point stops in varying volatility environments.
-
Clear Money Management: Through preset risk-reward ratios, each trade follows clear money management rules, ensuring long-term stability. Even with a moderate win rate, strict execution can maintain a positive expectancy over time.
-
Fully Automated Execution: The strategy can be fully automated from signal generation to stop-loss and take-profit settings, reducing delays from manual operations and emotional interference.
-
Bidirectional Trading: Supports both long and short positions, capturing opportunities in different market trends and improving capital utilization efficiency.
Strategy Risks
-
False Breakout Risk: In consolidating markets or highly volatile conditions, prices may frequently break through Bollinger Band boundaries but immediately revert, triggering frequent stop-losses. Solution: Add confirmation indicators or delay entry, consider waiting for a retest or reversal after the band breakout before entering.
-
Counter-Trend Risk in Trending Markets: In strong trending markets, prices may continue to run outside the Bollinger Bands, leading to consecutive losses with counter-trend trades. Recommendation: Add trend filters, only trade in the direction of the trend in strong trending markets, or completely pause trading.
-
Parameter Sensitivity: Inappropriate settings for Bollinger Band period and standard deviation multiplier can result in too many or too few signals. Solution: Find optimal parameter combinations through historical backtesting, consider dynamically adjusting parameters based on different market cycles.
-
Overtrading Risk: During periods of increased volatility, too many trading signals may be generated, leading to increased trading costs and overtrading. Recommendation: Set trading interval restrictions or add volume filters.
-
Limitations of Fixed Risk-Reward Ratio: The optimal risk-reward ratio may vary in different market environments. Consider using higher risk-reward ratios in trending markets and lower ratios with higher win rates in oscillating markets.
-
Lack of Trend Recognition: The strategy primarily relies on statistical mean reversion without recognizing market trends. Consider adding trend indicators as filtering conditions, such as moving average systems or the ADX indicator.
Strategy Optimization Directions
-
Add Trend Filters: Integrate moving average crossovers or ADX trend indicators, only trading when aligned with the trend direction, which can significantly improve win rate. For example, add 50 and 200 period moving averages to determine long-term trends, only going long in uptrends and short in downtrends.
-
Dynamic Risk-Reward Ratio: Adjust the risk-reward ratio dynamically based on market volatility or trend strength. Use higher risk-reward ratios (like 3:1 or 4:1) in strong trending markets, and lower ratios (like 1.5:1) with higher win rates in oscillating markets.
-
Multi-Timeframe Analysis: Introduce higher timeframe Bollinger Bands as filtering conditions, only entering when signals across multiple timeframes align, reducing false signals.
-
Optimize Entry Timing: Consider not entering immediately when price breaks through Bollinger Bands, but waiting for a retest or specific candlestick pattern formation, improving win rate.
-
Add Volume Confirmation: Use volume as a signal confirmation condition, requiring increased volume on breakouts to reduce false breakouts.
-
Implement Dynamic Take-Profit: Develop a trailing stop mechanism allowing profits to extend. For example, when price moves favorably by a certain distance, move the stop-loss to breakeven or a better position.
-
Seasonal or Time Filtering: Analyze market seasonality or optimal trading sessions, weighting trades during historically best-performing time periods.
-
Market Environment Classification: Develop a market environment classification system based on volatility, trend strength, and other indicators to categorize market states and apply different parameter settings for each state.
Conclusion
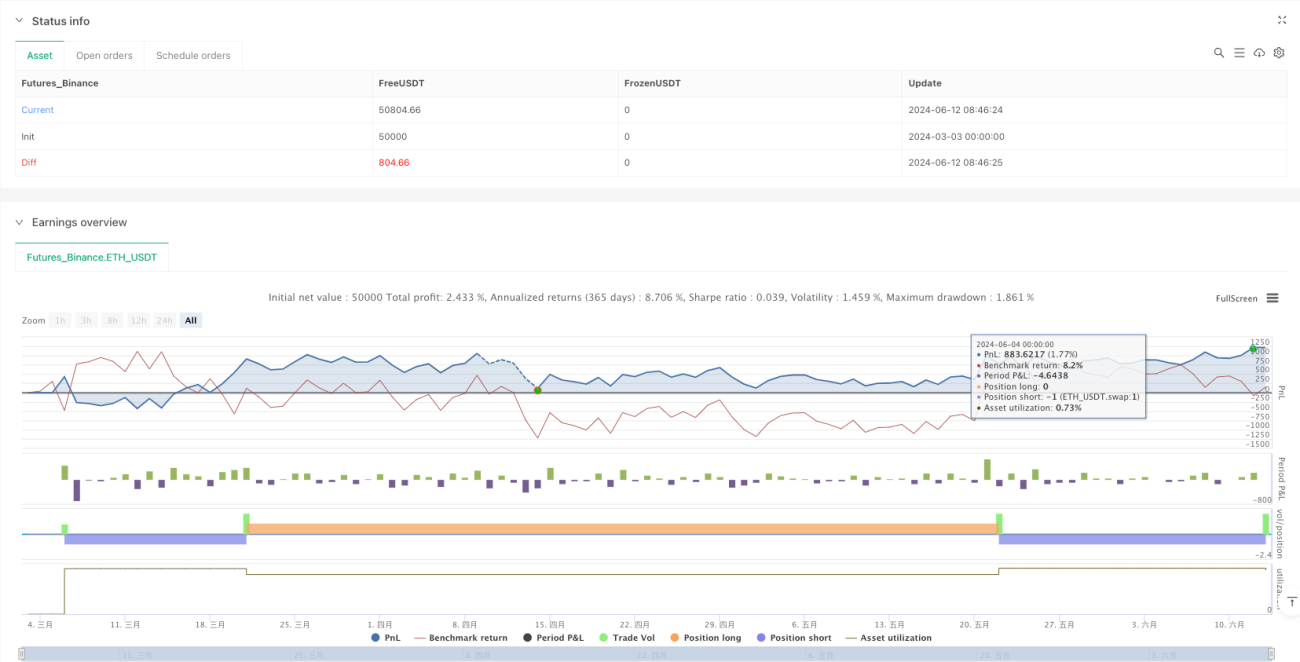
The Bollinger Bands ATR Risk-Reward Trading Strategy is a complete trading system based on statistical principles and risk management, identifying price anomalies through Bollinger Bands, calculating reasonable stop-loss levels with ATR, and automatically setting profit targets based on preset risk-reward ratios. The core advantage of this strategy lies in seamlessly combining technical analysis with risk management, adapting to changes in market volatility, and implementing strict money management for each trade.
While the strategy faces risks from false breakouts and counter-trend trading, its performance can be significantly improved through additions like trend filtering, multi-timeframe analysis, and dynamic risk-reward ratios. This strategy is suitable for traders who wish to follow systematic trading rules and emphasize risk control, particularly performing well in markets with high volatility but mean-reverting characteristics.
Ultimately, the key to successfully applying this strategy lies in strict execution of trading rules, continuous parameter optimization, and flexible adjustment of strategy settings for different market environments. Through ongoing testing and improvement, this strategy can evolve into a robust adaptive trading system.
- 1