Overview
The Multi-Dimensional EMA Trend Following with Volume and Volatility Confirmation Strategy is a comprehensive quantitative trading system that combines Exponential Moving Average (EMA), volume analysis, and volatility filtering. The strategy identifies potential trend entry opportunities by observing the relative position of price to EMA, historical price trend statistics, volume breakouts, and ATR volatility confirmation. The core idea is to execute trades when a clear price trend is forming, trading volume is increasing, and market volatility is moderate, thereby improving trade success rate and profitability.
Strategy Principles
The strategy operates based on four key components: 1. EMA Trend Identification: The strategy uses an Exponential Moving Average (EMA) of user-defined length as a baseline and determines the current trend direction by comparing closing prices to the EMA. 2. Historical Trend Strength Analysis: The strategy calculates the proportion of closing prices above and below the EMA during the lookback period (lookbackBars) to determine trend persistence and strength. When more than 50% of candles close above the EMA, it’s considered an uptrend; conversely, it’s considered a downtrend. 3. Volume Confirmation: The strategy requires current volume to exceed a specific multiple (volMultiplier) of the average volume during the lookback period, ensuring sufficient market participation to support price movements. 4. Volatility Filtering: The strategy uses the Average True Range (ATR) indicator to measure market volatility, requiring the current ATR percentage relative to closing price to exceed a preset threshold, ensuring the market has sufficient volatility to generate valid signals.
Buy signal conditions: - More than 50% of candles in the lookback period close above the EMA - Current candle closes above the EMA - Current volume is greater than average volume multiplied by the set multiplier - Current ATR percentage is greater than the volatility threshold
Sell signal conditions: - More than 50% of candles in the lookback period close below the EMA - Current candle closes below the EMA - Current volume is greater than average volume multiplied by the set multiplier - Current ATR percentage is greater than the volatility threshold
Strategy Advantages
- Multiple Confirmation Mechanism: The strategy not only focuses on price trends but also incorporates volume and volatility indicators for multiple confirmations, reducing false breakout signals and improving trade quality.
- Trend Persistence Assessment: By tracking the historical candles’ position relative to the EMA, the strategy can evaluate trend persistence and strength, avoiding entry during weak trends.
- Adaptability and Flexibility: The strategy provides multiple adjustable parameters (EMA length, lookback period, volume multiplier, ATR period, and threshold), allowing users to optimize according to different market environments and trading instruments.
- Visualization Support: The strategy provides visual elements such as the EMA line, trend strength ratio, and volume condition indicators, helping traders understand market conditions and strategy logic more intuitively.
- Low Liquidity Environment Filtering: Through volume conditions, the strategy automatically filters low liquidity environments, reducing slippage risk and the possibility of false signals.
- Volatility Adaptability: Through ATR volatility filtering, the strategy can trade in markets with reasonable volatility, avoiding poor signals in excessively calm or volatile market environments.
Strategy Risks
- Trend Reversal Risk: Although the strategy uses multiple confirmation mechanisms, it may still lag during rapid trend reversals, leading to suboptimal entry or exit timing. Solution: Consider adding faster reversal indicators or setting stop-loss strategies to limit losses.
- Parameter Optimization Overfitting: Excessive optimization of strategy parameters may lead to overfitting historical data, performing poorly in actual trading. Solution: Conduct parameter robustness tests across markets and time periods, maintaining reasonable parameter settings.
- Low Volatility Environment Performance: In extremely low volatility environments, the strategy may not generate trading signals for extended periods, affecting capital utilization efficiency. Solution: Set different parameter configurations for different volatility environments or combine with other types of strategies.
- Volume Anomaly Interference: Abnormally large volume spikes (such as after major news releases) may cause erroneous signals. Solution: Consider using volume standard deviation or other statistical methods to filter outliers.
- Parameter Sensitivity: Small changes in parameters like EMA length and lookback period may cause significant differences in strategy performance. Solution: Conduct parameter sensitivity analysis, selecting configurations that remain relatively stable in performance despite small parameter changes.
- Market Environment Adaptability: Strategy performance may be inconsistent across different market environments (such as trending vs. range-bound markets). Solution: Add market environment identification functionality to apply different trading rules or parameter settings in different environments.
Strategy Optimization Directions
- Adaptive Parameters: Design key parameters such as EMA length and lookback period to be adaptive, automatically adjusting based on market volatility and trend strength. This improves strategy adaptability across different market environments, reducing the need for manual parameter adjustments.
- Stop-Loss Mechanism Improvement: Add intelligent stop-loss mechanisms, such as ATR-based dynamic stop-loss or condition-based stop-loss triggered by strategy signal reversal, to protect existing profits and limit single trade losses.
- Market Environment Classification: Add market environment classification logic, such as distinguishing between trending and range-bound markets, and apply different trading rules or parameter configurations in different environments to improve strategy adaptability.
- Multi-Timeframe Analysis: Introduce multi-timeframe analysis, trading only when the higher timeframe trend direction aligns with the current timeframe, improving trend judgment accuracy.
- Volume Analysis Optimization: Refine volume analysis methods by considering characteristics such as volume growth rate and continuity, rather than simply comparing to average values, to obtain more precise volume confirmation signals.
- Machine Learning Enhancement: Attempt to incorporate machine learning algorithms to optimize signal generation, such as training models on historical data to predict which condition combinations are more likely to lead to successful trades.
- Dynamic Trade Sizing: Dynamically adjust trade size based on signal strength (such as the difference between trend ratio and threshold, the extent volume exceeds average, etc.), increasing position size with stronger signals to improve capital utilization efficiency.
- Correlation Filtering: Add correlation analysis with related markets or indices, trading only when supported by correlations, reducing false signals caused by broad market factors.
Summary
The Multi-Dimensional EMA Trend Following with Volume and Volatility Confirmation Strategy is a comprehensive trading system that combines price trend, historical pattern, volume, and volatility analysis across multiple dimensions. By simultaneously considering price position relative to EMA, historical trend strength, volume breakouts, and volatility confirmation, the strategy can effectively identify trend entry opportunities with continuation potential.
The core advantage of the strategy lies in its multiple confirmation mechanisms and flexible parameter configuration, allowing it to adapt to different market environments. However, the strategy also faces challenges in parameter optimization, market environment adaptability, and signal lag. By introducing adaptive parameters, improving stop-loss mechanisms, adding market environment classification, and multi-timeframe analysis, the strategy’s robustness and profitability can be further enhanced.
For quantitative traders, this strategy provides a solid framework that can be further customized and optimized according to individual trading styles and target market characteristics. By understanding the principles and logic behind the strategy, traders can better capitalize on market trend opportunities and improve the quality and consistency of trading decisions.
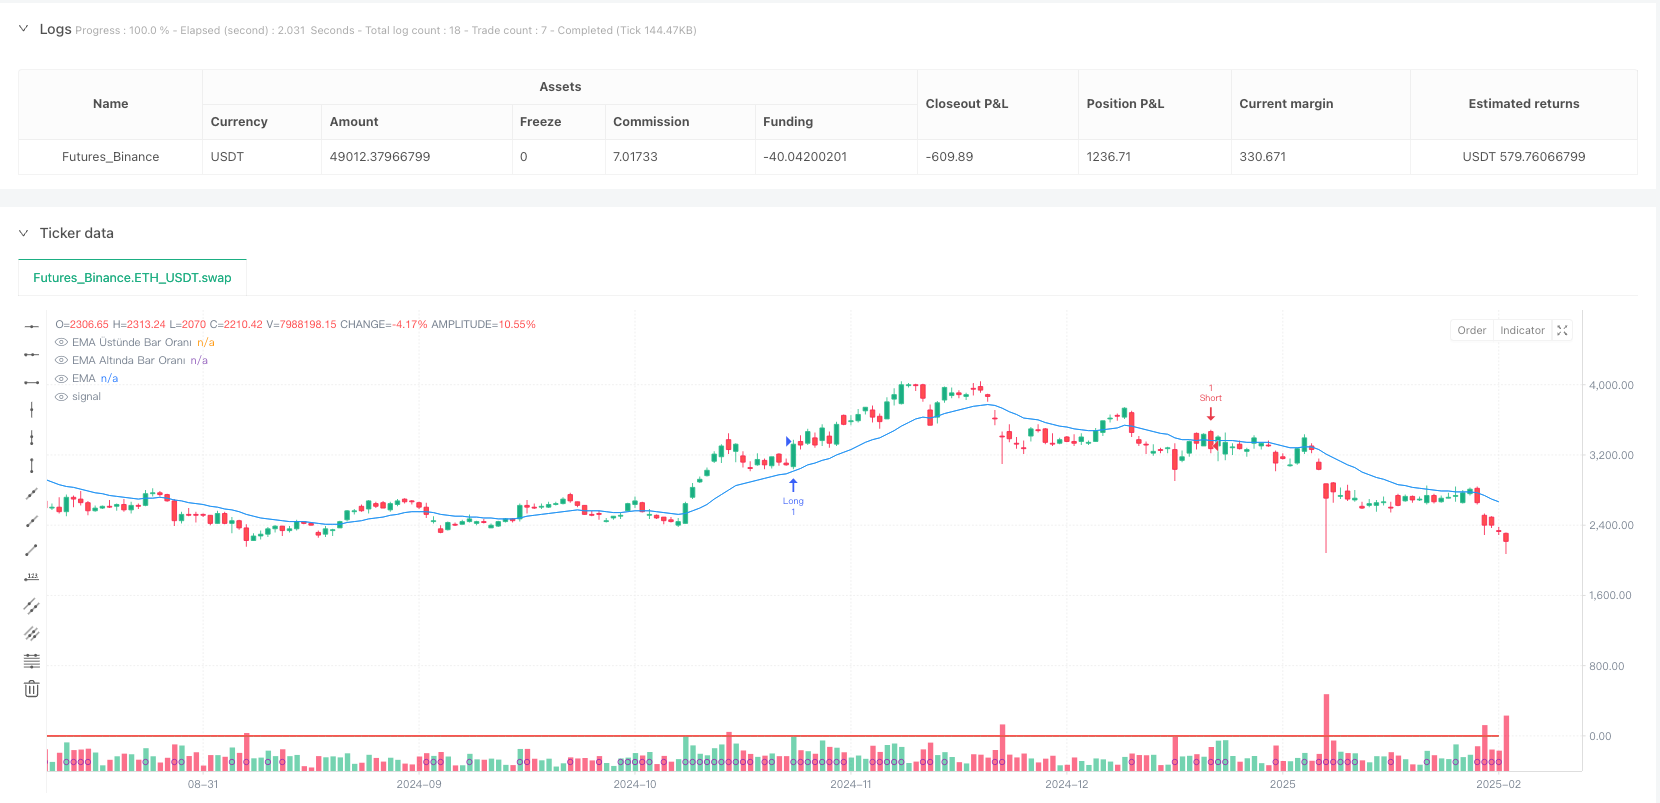
/*backtest
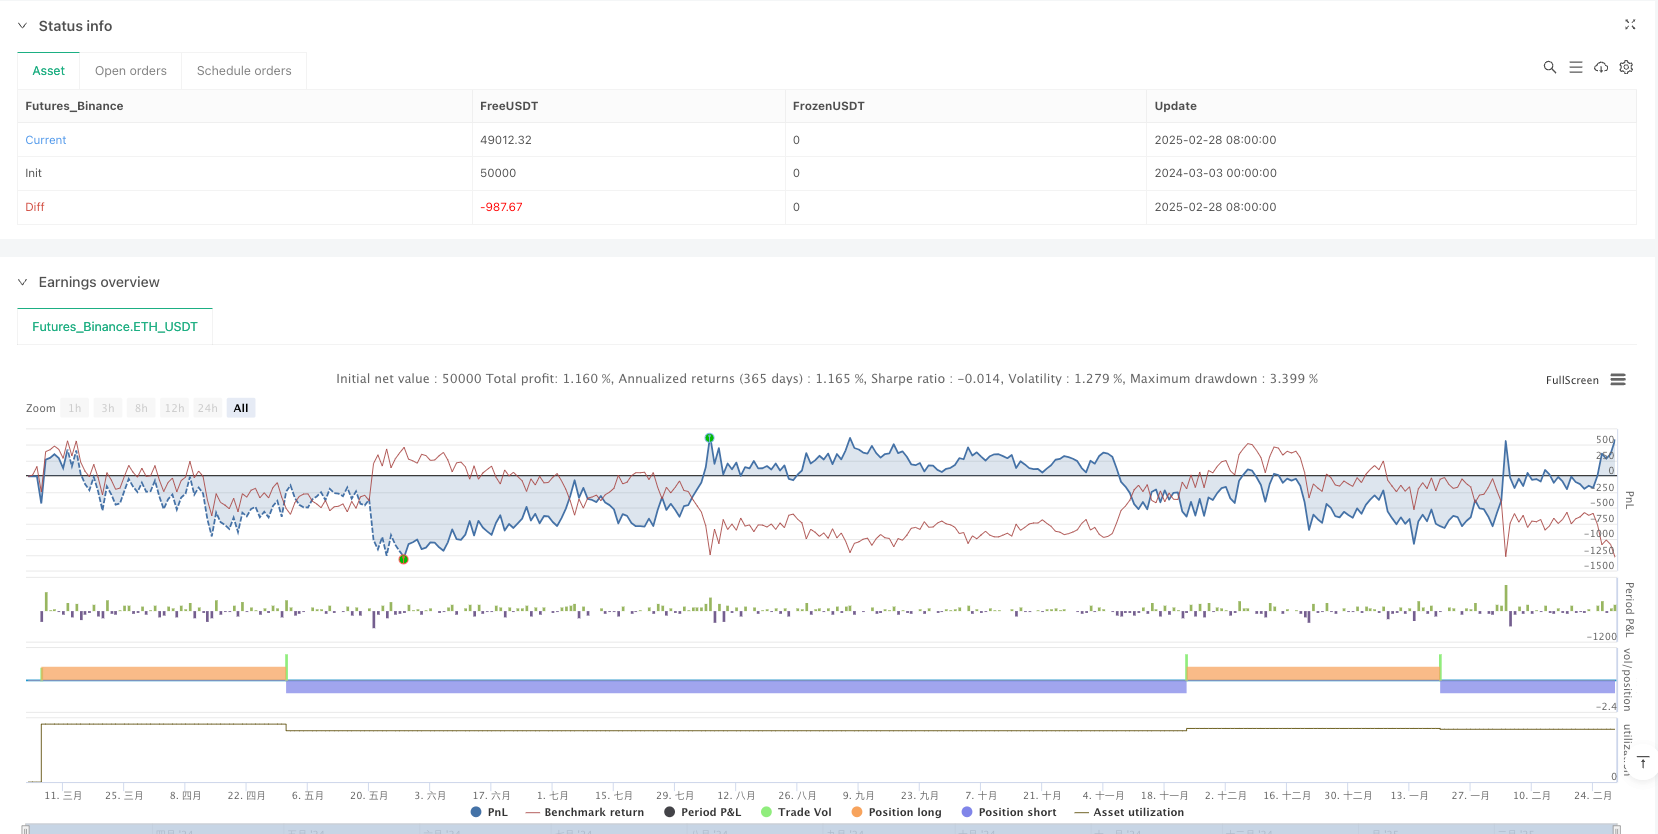
start: 2024-03-03 00:00:00
end: 2025-03-01 08:00:00
period: 1d
basePeriod: 1d
exchanges: [{"eid":"Futures_Binance","currency":"ETH_USDT"}]
*/
//@version=5
strategy("EMA, Hacim ve Volatilite Stratejisi", overlay=true, initial_capital=10000, currency=currency.USD)
// Kullanıcı girdileri
emaLength = input.int(20, "EMA Uzunluğu", minval=1)
lookbackBars = input.int(50, "Bakış Periyodu (Bar Sayısı)", minval=1)
volMultiplier = input.float(1.0, "Hacim Çarpanı (Ortalama Hacim x)", step=0.1)
atrPeriod = input.int(14, "ATR Periyodu", minval=1)
atrPercentThreshold = input.float(0.01, "ATR Yüzde Eşiği (Örn: 0.01 = %1)", step=0.001)
// EMA hesaplaması
emaSeries = ta.ema(close, emaLength)
plot(emaSeries, color=color.blue, title="EMA")
// Son lookbackBars barı içerisinde, kapanışın EMA'nın üzerinde olduğu bar sayısını hesaplamak için döngü
barsAboveEMA = 0.0
for i = 0 to lookbackBars - 1
barsAboveEMA := barsAboveEMA + (close[i] > emaSeries[i] ? 1.0 : 0.0)
ratioAbove = barsAboveEMA / lookbackBars
// Son lookbackBars barı içerisinde, kapanışın EMA'nın altında olduğu bar sayısını hesaplamak için döngü
barsBelowEMA = 0.0
for i = 0 to lookbackBars - 1
barsBelowEMA := barsBelowEMA + (close[i] < emaSeries[i] ? 1.0 : 0.0)
ratioBelow = barsBelowEMA / lookbackBars
// Hacim filtresi: Mevcut barın hacmi, lookbackBars süresince hesaplanan ortalama hacmin volMultiplier katından yüksek olmalı
avgVolume = ta.sma(volume, lookbackBars)
volumeCondition = volume > volMultiplier * avgVolume
// Volatilite filtresi: ATR değerinin, kapanışa oranı belirlenen eşikten yüksek olmalı
atrValue = ta.atr(atrPeriod)
atrPercent = atrValue / close
volatilityCondition = atrPercent > atrPercentThreshold
// Long ve Short giriş koşulları:
// Long: lookbackBars barının %50'sinden fazlası EMA üzerinde ve son barın kapanışı EMA üzerinde; hacim ve volatilite şartları sağlanmalı
longCondition = (ratioAbove > 0.5) and (close > emaSeries) and volumeCondition and volatilityCondition
// Short: lookbackBars barının %50'sinden fazlası EMA altında ve son barın kapanışı EMA altında; hacim ve volatilite şartları sağlanmalı
shortCondition = (ratioBelow > 0.5) and (close < emaSeries) and volumeCondition and volatilityCondition
// Ekstra görselleştirmeler
plot(ratioAbove, color=color.green, title="EMA Üstünde Bar Oranı", linewidth=2)
plot(ratioBelow, color=color.red, title="EMA Altında Bar Oranı", linewidth=2)
plotshape(volumeCondition, title="Hacim Şartı", style=shape.circle, location=location.bottom, color=color.purple, size=size.tiny)
// İşlem sinyalleri
if longCondition
strategy.entry("Long", strategy.long)
if shortCondition
strategy.entry("Short", strategy.short)